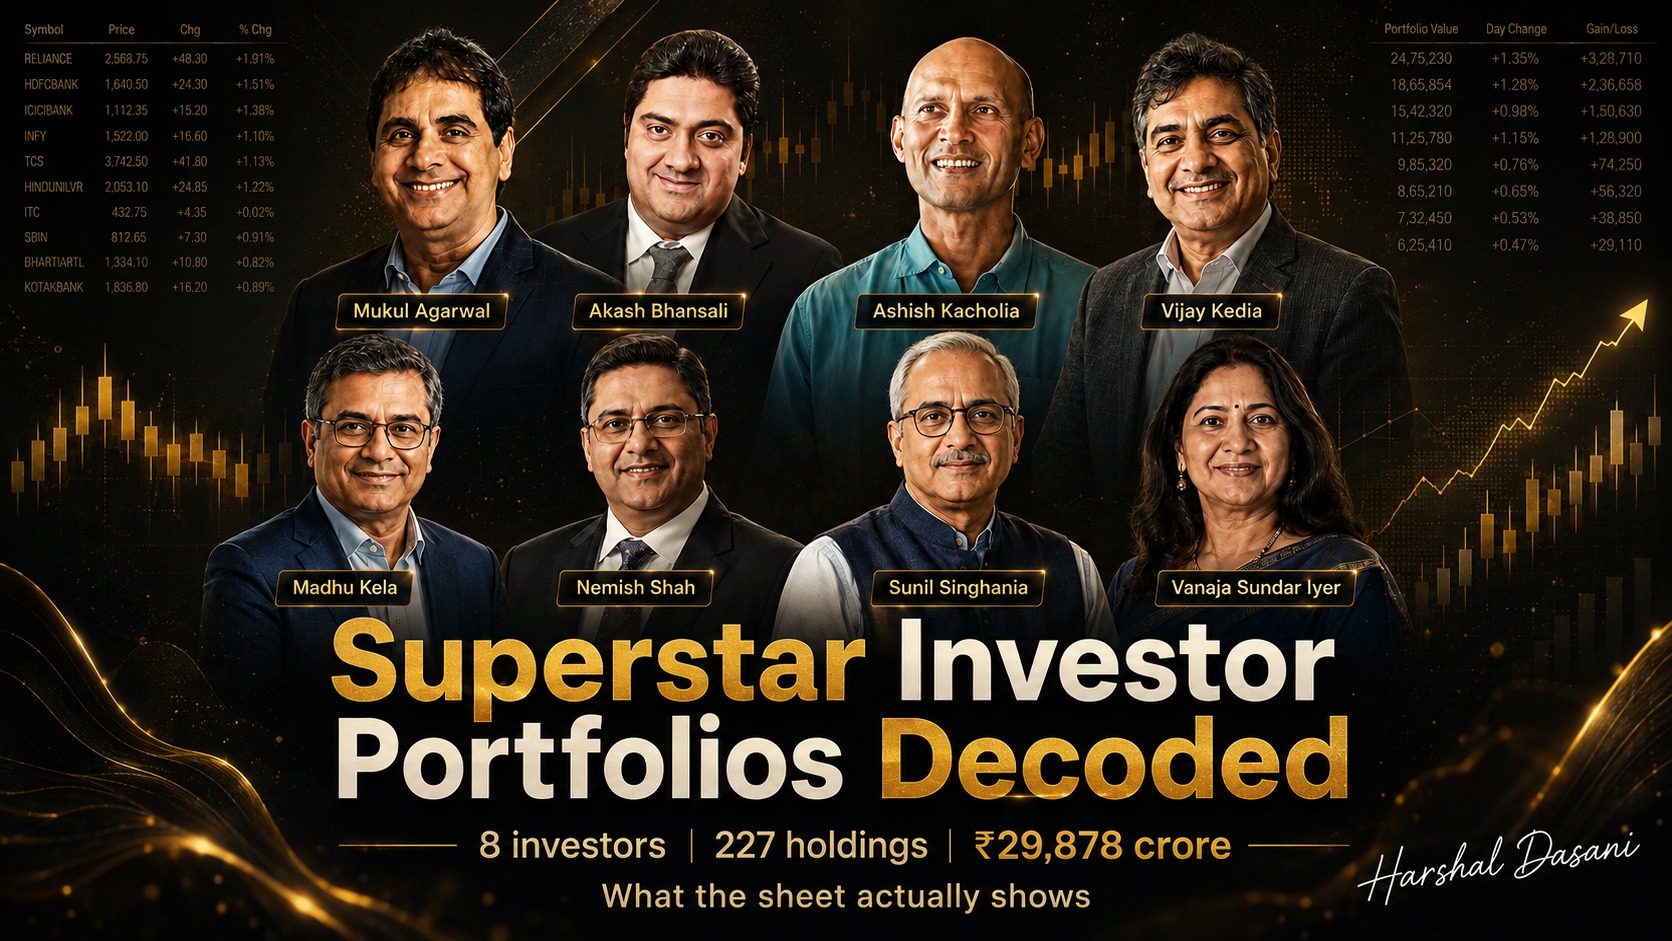
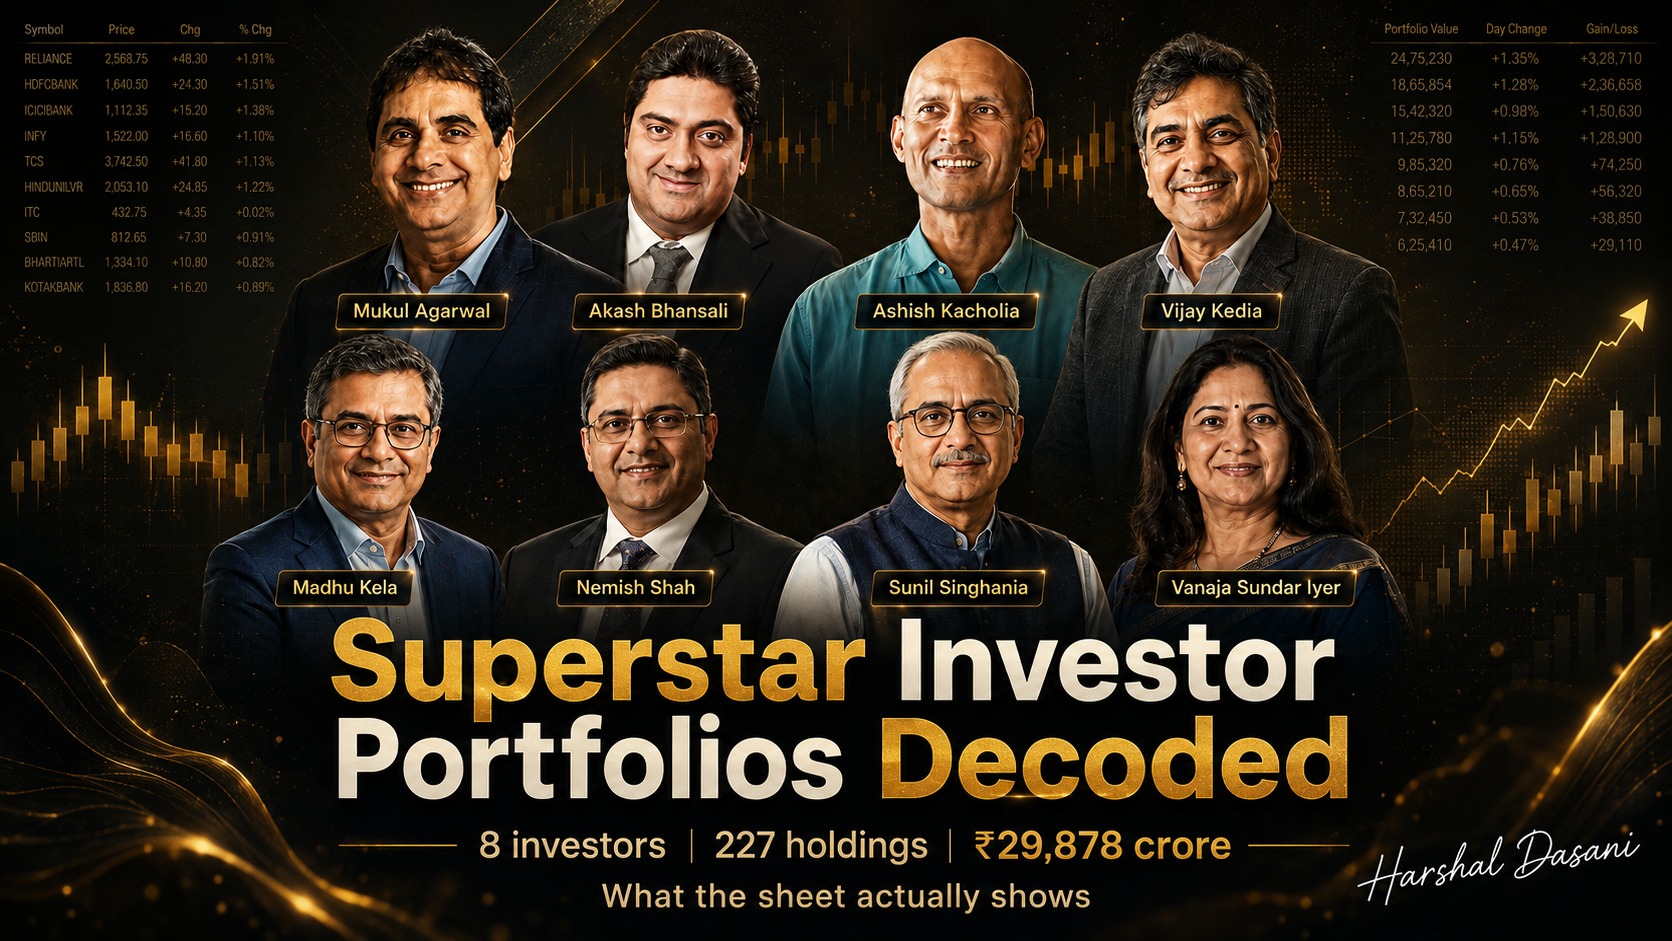
Someone shares a screenshot of a famous investor's holdings and the reaction is always the same: which one do I buy. That is the least interesting question you can ask of this data. The interesting question is what the shape of each book tells you about how that investor actually operates, because on that, the data is unusually revealing.
What follows is the full set, eight investors, 227 disclosed positions, ₹29,878 crore of disclosed value, with every holding shown as a percentage of that investor's own book. The percentages are the point. A ₹100 crore position means something completely different in a five-stock portfolio than in a seventy-stock one.
Not a recommendation. This is a data exercise on public disclosures, not investment advice, and these holdings may already have changed. The full disclaimer, source note and author disclosure are at the end of this post, please read them.
The eight books at a glance
Before the individual tables, the summary. Note the spread in the number of holdings: from five to seventy-two. These are not variations on one style, they are different games entirely.
| Investor | Holdings | Disclosed (₹ Cr) | Share of all eight | Largest position |
|---|---|---|---|---|
| Akash Bhansali | 17 | 7,985 | 26.7% | 31.0% |
| Mukul Agarwal | 72 | 7,476 | 25.0% | 10.2% |
| Nemish Shah | 5 | 3,531 | 11.8% | 49.0% |
| Ashish Kacholia | 48 | 2,933 | 9.8% | 25.0% |
| Madhu Kela | 19 | 2,666 | 8.9% | 48.4% |
| Sunil Singhania | 31 | 2,489 | 8.3% | 9.0% |
| Vanaja Sundar Iyer | 14 | 1,418 | 4.7% | 40.8% |
| Vijay Kedia | 21 | 1,381 | 4.6% | 22.0% |
Two investors, Akash Bhansali and Mukul Agarwal, account for just over half the rupee value in the set while holding 89 of the 227 positions. And the largest-position column is the whole story in one number: Nemish Shah's biggest line is 49% of his book, Sunil Singhania's is 9%.
Akash Bhansali: few names, large positions
17 holdings · ₹7,985 crore disclosed · 26.7% of the eight-investor pool. 17 names, but the top three, Gujarat Fluorochemicals, Laurus Labs and One97 Communications, are 63% of the book. The single Gujarat Fluorochemicals line, at ₹2,473 crore, is larger than the entire disclosed book of two of the other seven investors here.
| Company | Value (₹ Cr) | % of disclosed value |
|---|---|---|
| Gujarat Fluorochemicals | 2,472.9 | 31.0% |
| Laurus Labs | 1,278.2 | 16.0% |
| One97 Communications | 1,269.8 | 15.9% |
| Sudarshan Chemical | 626.8 | 7.8% |
| Schneider Electric | 443.5 | 5.6% |
| Ramkrishna Forgings | 296.8 | 3.7% |
| Amber Enterprises | 292.0 | 3.7% |
| Greenlam Industries | 284.5 | 3.6% |
| Inox Wind | 223.1 | 2.8% |
| Welspun Living | 220.4 | 2.8% |
| Aptus Value Housing | 190.7 | 2.4% |
| Natco Pharma | 162.6 | 2.0% |
| Genus Power | 111.5 | 1.4% |
| Dilip Buildcon | 86.6 | 1.1% |
| GeeCee Ventures | 23.4 | 0.3% |
| Praxis Home Retail | 2.5 | 0.0% |
| Pan Electronics | — | — |
| Total (disclosed) | 7,985.3 | 100.0% |
Mukul Agarwal: the widest book here
72 holdings · ₹7,476 crore disclosed · 25.0% of the eight-investor pool. 72 names and the flattest distribution of the eight. His largest position is only 10.2% of the book; the top five are 34%. It is the distribution of a portfolio in which no single idea has to be right.
| Company | Value (₹ Cr) | % of disclosed value |
|---|---|---|
| Neuland Laboratories | 761.7 | 10.2% |
| ASM Technologies | 727.4 | 9.7% |
| Nuvama Wealth | 451.0 | 6.0% |
| Zota Healthcare | 322.2 | 4.3% |
| PTC Industries | 283.8 | 3.8% |
| Jammu & Kashmir Bank | 257.4 | 3.4% |
| Deepak Fertilisers | 232.9 | 3.1% |
| Sarda Energy & Minerals | 206.6 | 2.8% |
| MPS | 205.6 | 2.8% |
| Dishman Carbogen | 161.1 | 2.2% |
| LT Foods | 160.0 | 2.1% |
| Kingfa Science | 157.5 | 2.1% |
| Concord Control | 146.6 | 2.0% |
| KDDL | 139.7 | 1.9% |
| Sudeep Pharma | 132.2 | 1.8% |
| Intellect Design Arena | 128.9 | 1.7% |
| PDS | 122.2 | 1.6% |
| Indo Count | 120.4 | 1.6% |
| Capacit'e Infraprojects | 120.2 | 1.6% |
| KRN Heat Exchanger | 117.4 | 1.6% |
| Zelio EMobility | 114.9 | 1.5% |
| TAAL Tech | 108.7 | 1.5% |
| Hindustan Constrn | 107.2 | 1.4% |
| Strides Pharma | 105.4 | 1.4% |
| Valor Estate | 95.9 | 1.3% |
| Kirloskar Ferrous | 94.5 | 1.3% |
| J Kumar Infraprojects | 93.1 | 1.2% |
| Yatharth Hospital | 90.0 | 1.2% |
| Tatva Chintan Pharma | 89.4 | 1.2% |
| India Metals & Ferro Alloys | 83.2 | 1.1% |
| Arman Fin Serv | 77.6 | 1.0% |
| Apollo Pipes | 77.3 | 1.0% |
| WPIL | 69.4 | 0.9% |
| Hind Rectifiers | 66.9 | 0.9% |
| IFB Industries | 65.8 | 0.9% |
| E to E Transportation | 64.4 | 0.9% |
| Sirca Paints | 60.3 | 0.8% |
| Lux Industries | 58.0 | 0.8% |
| AYM Syntex | 58.0 | 0.8% |
| Osel Devices | 55.3 | 0.7% |
| West Coast Paper | 54.1 | 0.7% |
| Monolithisch | 51.5 | 0.7% |
| InfoBeans Tech | 50.1 | 0.7% |
| Raymond Lifestyle | 49.7 | 0.7% |
| Suryoday Small Finance Bank | 48.6 | 0.7% |
| Ajmera Realty | 48.0 | 0.6% |
| Wendt | 41.0 | 0.5% |
| Ravindra Energy | 40.8 | 0.5% |
| Prakash Industries | 38.0 | 0.5% |
| Thejo Engineering | 38.0 | 0.5% |
| Unified Data Tech Solutions | 37.6 | 0.5% |
| Oriental Rail | 37.3 | 0.5% |
| Protean eGov Tech | 37.0 | 0.5% |
| Allcargo Logistics | 35.4 | 0.5% |
| Gaudium IVF And Women Health | 34.4 | 0.5% |
| Laxmi Finance | 30.4 | 0.4% |
| Vidhi Specialty Food | 22.7 | 0.3% |
| Bella Casa Fashion | 21.8 | 0.3% |
| Sahasra Electronic Solutions | 21.4 | 0.3% |
| Arisinfra Solutions | 16.7 | 0.2% |
| N R Agarwal Industries | 16.6 | 0.2% |
| Vasa Denticity | 16.1 | 0.2% |
| Transpek Industry | 15.6 | 0.2% |
| Prakash Pipes | 15.0 | 0.2% |
| Brandman Retail | 13.3 | 0.2% |
| Solarium Green Energy | 10.3 | 0.1% |
| Autoriders Intl | 10.2 | 0.1% |
| Kilitch Drugs | 8.8 | 0.1% |
| Siyaram Recycling | 8.2 | 0.1% |
| True Colors | 6.5 | 0.1% |
| Tracxn Technologies | 6.1 | 0.1% |
| Yaap Digital | 4.5 | 0.1% |
| Total (disclosed) | 7,475.8 | 100.0% |
Nemish Shah: five names, that is all
5 holdings · ₹3,531 crore disclosed · 11.8% of the eight-investor pool. The most concentrated book in the dataset by a distance. Two names, Lakshmi Machine Works and Asahi India Glass, are 87.5% of it. He also shares no company with any other investor on this list.
| Company | Value (₹ Cr) | % of disclosed value |
|---|---|---|
| Lakshmi Machine | 1,729.1 | 49.0% |
| Asahi Glass | 1,360.2 | 38.5% |
| Elgi Equipments | 326.7 | 9.3% |
| Bannari Amman Sugars | 112.1 | 3.2% |
| Zodiac Clothing | 3.0 | 0.1% |
| Total (disclosed) | 3,531.1 | 100.0% |
Ashish Kacholia: the long tail specialist
48 holdings · ₹2,933 crore disclosed · 9.8% of the eight-investor pool. 48 names with a median position of ₹24 Cr. Thirteen positions sit under ₹10 Cr, more sub-₹10-crore lines than the other seven investors put together, which is the shape typically associated with early-stage smallcap investing.
| Company | Value (₹ Cr) | % of disclosed value |
|---|---|---|
| Shaily Engineering | 732.8 | 25.0% |
| Beta Drugs | 273.1 | 9.3% |
| Knowledge Marine Engg | 173.7 | 5.9% |
| Safari Industries | 140.4 | 4.8% |
| Xpro | 137.8 | 4.7% |
| Aeroflex Industries | 131.0 | 4.5% |
| Man Industries | 121.2 | 4.1% |
| Carysil | 117.5 | 4.0% |
| Tanfac Industries | 104.5 | 3.6% |
| Yasho Industries | 96.6 | 3.3% |
| Fineotex Chemical | 94.3 | 3.2% |
| Balu Forge | 83.3 | 2.8% |
| Faze Three | 70.7 | 2.4% |
| Zaggle Prepaid Ocean | 59.4 | 2.0% |
| Advait Energy | 46.2 | 1.6% |
| Stove Kraft | 44.9 | 1.5% |
| Shree Refrigerations | 37.8 | 1.3% |
| Concord Control | 37.1 | 1.3% |
| Agarwal Industrial | 32.4 | 1.1% |
| Indo Smc | 30.5 | 1.0% |
| Vikran Engineering | 28.4 | 1.0% |
| Z-Tech | 28.1 | 1.0% |
| Quadrant Future Tek | 26.5 | 0.9% |
| Dhabriya Polywood | 25.1 | 0.9% |
| Asian Energy | 22.9 | 0.8% |
| Qualitek Labs | 21.4 | 0.7% |
| Bharat Parenterals | 19.0 | 0.6% |
| V-Marc | 18.4 | 0.6% |
| C2C Advanced Systems | 17.1 | 0.6% |
| DU Digital Global | 15.9 | 0.5% |
| TechEra Engineering | 15.7 | 0.5% |
| Infinium Pharmachem | 15.0 | 0.5% |
| Finbud Financial Services | 14.8 | 0.5% |
| Aelea Commodities | 12.5 | 0.4% |
| Gujarat Apollo Ind | 10.2 | 0.3% |
| Thomas Scott | 9.2 | 0.3% |
| Vasa Denticity | 8.8 | 0.3% |
| Texel Industries | 7.5 | 0.3% |
| BEW Engineering | 7.0 | 0.2% |
| Inflame Appliances | 6.9 | 0.2% |
| Megatherm Induction | 6.6 | 0.2% |
| Sanjivani Paranteral | 6.0 | 0.2% |
| Adcounty Media | 5.5 | 0.2% |
| Naman In-Store | 4.9 | 0.2% |
| TBI Corn | 4.8 | 0.2% |
| Brand Concepts | 3.4 | 0.1% |
| Shree OSFM E-Mobility | 3.2 | 0.1% |
| Pratham EPC Projects | 2.7 | 0.1% |
| Total (disclosed) | 2,932.7 | 100.0% |
Madhu Kela: one dominant line
19 holdings · ₹2,666 crore disclosed · 8.9% of the eight-investor pool. Choice International alone is 48% of the disclosed book. Note that Mkventures Capital, the second-largest line, is a listed company in which Madhusudan Kela and family are disclosed as promoters in the company's own filings, so that line reflects a promoter shareholding rather than a position in an unrelated company.
| Company | Value (₹ Cr) | % of disclosed value |
|---|---|---|
| Choice International | 1,291.4 | 48.4% |
| Mkventures Capital | 306.4 | 11.5% |
| Windsor Machines | 197.1 | 7.4% |
| Sangam | 146.7 | 5.5% |
| Indiabulls | 139.7 | 5.2% |
| Prataap Snacks | 131.1 | 4.9% |
| Rashi Peripherals | 97.0 | 3.6% |
| Indostar Capital | 80.9 | 3.0% |
| SG Finserve | 63.0 | 2.4% |
| Subam Papers | 42.4 | 1.6% |
| Bombay Dyeing | 36.0 | 1.4% |
| Niyogin Fintech | 26.3 | 1.0% |
| IRIS RegTech | 25.6 | 1.0% |
| Simplex Infra | 23.9 | 0.9% |
| Kopran | 15.8 | 0.6% |
| Repro | 15.4 | 0.6% |
| Unicommerce eSolutions | 14.3 | 0.5% |
| Emkay Global | 6.9 | 0.3% |
| Aptech | 5.7 | 0.2% |
| Total (disclosed) | 2,665.6 | 100.0% |
Sunil Singhania: institutional shape
31 holdings · ₹2,489 crore disclosed · 8.3% of the eight-investor pool. 31 names, largest position 9%, top five 35%. The distribution has the shape usually associated with institutional portfolios, spread across engineering, pharma, electronics manufacturing and financials.
| Company | Value (₹ Cr) | % of disclosed value |
|---|---|---|
| Dynamatic Tech | 223.5 | 9.0% |
| Carysil | 179.3 | 7.2% |
| Technocraft Industries | 159.7 | 6.4% |
| Jubilant Pharmova | 158.9 | 6.4% |
| Avalon Technologies | 139.7 | 5.6% |
| The Anup Engineering | 132.5 | 5.3% |
| IIFL Capital | 130.6 | 5.2% |
| Stylam Industries | 128.7 | 5.2% |
| Cyient DLM | 123.2 | 4.9% |
| Arvind Fashions | 111.2 | 4.5% |
| Ion Exchange | 101.2 | 4.1% |
| Suven Life Sciences | 97.0 | 3.9% |
| J Kumar Infraprojects | 93.2 | 3.7% |
| All Time Plastics | 86.9 | 3.5% |
| Afcom Holdings | 85.0 | 3.4% |
| Mastek | 72.0 | 2.9% |
| Aye Finance | 46.9 | 1.9% |
| Heritage Foods | 46.5 | 1.9% |
| HG Infra Engineering | 46.4 | 1.9% |
| Siyaram Silk Mills | 46.1 | 1.9% |
| Rupa & Company | 41.2 | 1.7% |
| Hindware Home Innovation | 40.3 | 1.6% |
| Sejal Glass | 34.0 | 1.4% |
| TTK Healthcare | 33.9 | 1.4% |
| M B Engineering | 31.3 | 1.3% |
| Jaro Institute of Technology | 22.9 | 0.9% |
| Mangal Electrical Industries | 21.8 | 0.9% |
| DCM Shriram International | 20.5 | 0.8% |
| Indogulf Cropsciences | 18.0 | 0.7% |
| DCM Shriram | 10.3 | 0.4% |
| DCM Shriram Fine Chemicals | 6.3 | 0.3% |
| Total (disclosed) | 2,489.0 | 100.0% |
Vanaja Sundar Iyer: quality, tightly held
14 holdings · ₹1,418 crore disclosed · 4.7% of the eight-investor pool. A compact book where Linde India and Acutaas Chemicals are 62% of the value. Two positions in her book carry no disclosed value in the source data.
| Company | Value (₹ Cr) | % of disclosed value |
|---|---|---|
| Linde | 577.9 | 40.8% |
| Acutaas Chemicals | 300.9 | 21.2% |
| SML Mahindra | 138.7 | 9.8% |
| Tanfac Industries | 93.2 | 6.6% |
| Stylam Industries | 69.6 | 4.9% |
| Indraprastha Medical | 67.4 | 4.8% |
| Hirect | 44.0 | 3.1% |
| Belding | 37.2 | 2.6% |
| Xpro | 32.3 | 2.3% |
| Anondita Medicare | 32.1 | 2.3% |
| Solarworld Energy Solutions | 21.0 | 1.5% |
| Twentyfirst Century | 3.6 | 0.3% |
| Aurionpro Solutions | — | — |
| Bajaj Healthcare | — | — |
| Total (disclosed) | 1,417.9 | 100.0% |
Vijay Kedia: no small positions
21 holdings · ₹1,381 crore disclosed · 4.6% of the eight-investor pool. 21 names and not one below ₹15 Cr, the tightest floor of the eight. He is also the most connected investor here, sharing a name with five of the other seven.
| Company | Value (₹ Cr) | % of disclosed value |
|---|---|---|
| Neuland Laboratories | 303.2 | 22.0% |
| Atul Auto | 287.0 | 20.8% |
| Sudarshan Chemical | 111.8 | 8.1% |
| Elecon Engineering | 97.3 | 7.0% |
| Yatharth Hospital | 81.5 | 5.9% |
| Vaibhav Global | 78.2 | 5.7% |
| Mahindra Resorts | 45.9 | 3.3% |
| Exato Technologies | 43.8 | 3.2% |
| Websol Energy | 40.7 | 2.9% |
| TAC Infosec | 35.4 | 2.6% |
| Repro | 29.4 | 2.1% |
| Siyaram Silk Mills | 29.0 | 2.1% |
| SPML Infra | 28.5 | 2.1% |
| Patel Engineering | 28.5 | 2.1% |
| Advait Energy | 26.2 | 1.9% |
| TechD Cybersecurity | 22.6 | 1.6% |
| Om Infra | 20.4 | 1.5% |
| Mahamaya Lifesciences | 19.7 | 1.4% |
| Innovators Facade Sys | 19.7 | 1.4% |
| Eimco Elecon | 16.8 | 1.2% |
| Affordable Robotic | 15.1 | 1.1% |
| Total (disclosed) | 1,380.7 | 100.0% |
The 13 stocks more than one of them owns
This is where the data gets genuinely surprising. Out of 214 distinct companies across the eight books, only 13 appear in more than one portfolio, and not a single one is held by three or more. The "superstar consensus stock" does not exist here.
| Company | Held by | Combined (₹ Cr) |
|---|---|---|
| Neuland Laboratories | Mukul Agarwal (761.7) · Vijay Kedia (303.2) | 1,064.9 |
| Sudarshan Chemical | Akash Bhansali (626.8) · Vijay Kedia (111.8) | 738.6 |
| Carysil | Sunil Singhania (179.3) · Ashish Kacholia (117.5) | 296.8 |
| Stylam Industries | Sunil Singhania (128.7) · Vanaja Sundar Iyer (69.6) | 198.3 |
| Tanfac Industries | Ashish Kacholia (104.5) · Vanaja Sundar Iyer (93.2) | 197.7 |
| J Kumar Infraprojects | Sunil Singhania (93.2) · Mukul Agarwal (93.1) | 186.3 |
| Concord Control | Mukul Agarwal (146.6) · Ashish Kacholia (37.1) | 183.7 |
| Yatharth Hospital | Mukul Agarwal (90.0) · Vijay Kedia (81.5) | 171.5 |
| Xpro | Ashish Kacholia (137.8) · Vanaja Sundar Iyer (32.3) | 170.1 |
| Siyaram Silk Mills | Sunil Singhania (46.1) · Vijay Kedia (29.0) | 75.1 |
| Advait Energy | Ashish Kacholia (46.2) · Vijay Kedia (26.2) | 72.4 |
| Repro | Vijay Kedia (29.4) · Madhu Kela (15.4) | 44.8 |
| Vasa Denticity | Mukul Agarwal (16.1) · Ashish Kacholia (8.8) | 24.9 |
Overlap here is an artefact of two independently built books touching the same name. It is not evidence of agreement between these investors, it is not a signal, and it is not a shortlist.
One note on the data: Vanaja Sundar Iyer's "Hirect" and Mukul Agarwal's "Hind Rectifiers" are almost certainly the same company, Hind Rectifiers trades under the Hirect brand. If you count it, the overlap list becomes 14.
What the shapes actually tell you
One caveat applies to everything in this section: these are statements about the disclosed subset, not anyone's total portfolio. Because holdings under 1% of a company's equity never appear, a book that looks concentrated here may be far less concentrated in reality, and an investor shown with five names may hold many more.
Concentration varies by a factor of ten. On the disclosed data, Mukul Agarwal's book behaves like roughly 27 equally weighted positions; Nemish Shah's behaves like about 2.5. Both are called superstar investors. They are not doing the same job.
Size and breadth are separate decisions. Bhansali runs 17 names averaging ₹470 crore. Kacholia runs 48 averaging ₹61 crore. Bhansali's single Gujarat Fluorochemicals position is 84% the size of Kacholia's entire disclosed book, and neither approach is wrong, they are answers to different questions.
The long tail is a strategy, not sloppiness. Half of Kacholia's positions are under ₹25 crore. In a smallcap book, small early positions are how you buy optionality on companies too illiquid to enter at size later.
The money is concentrated even if the names are not. The ten largest positions across all eight books are 41% of the total value. Half of all 227 rows are under ₹50 crore and add up to under 9%.
The honest conclusion
The useful takeaway from a sheet like this is not a shopping list. It is the reminder that position sizing is the decision that actually separates these investors, and it is the part that gets stripped out when a screenshot circulates with only company names on it. Anyone can copy a name. Nobody can copy conviction, holding period, or the ability to sit through a 40% drawdown in a position that is 30% of the book.
And it bears repeating, because the format of this post invites exactly the wrong reaction: these are disclosures from a point in time, they may be stale, they are incomplete by construction, and none of it is a recommendation to buy or sell anything.
Disclaimer, source and disclosures
- This is not a buy or sell recommendation. Nothing here is investment advice, a recommendation, or a suggestion to act on any stock named below. It is a data exercise, nothing more.
- These holdings may already have changed. Disclosed shareholdings are a snapshot from public filings and are reported with a lag. Investors buy and sell continuously. By the time you read this, any position here may have been added to, trimmed, or exited entirely.
- Only disclosures above the threshold are visible. Indian companies disclose individual shareholders only above 1% of equity. Every book below is therefore incomplete, positions under that line simply do not appear, so no investor's real portfolio is what you see here.
- Values move with the market. Rupee values are a function of price on a given day. The percentages change every session even when the underlying holding does not.
- Copying anyone is a bad plan. These investors have different capital, time horizons, risk tolerance and information than you. A name on this list tells you nothing about whether it suits your circumstances.
- Where this comes from. The holdings are compiled from company shareholding disclosures as they appeared in a publicly circulated compilation reviewed on 18 August 2026. Rupee values reflect market prices around that date and will differ on any other day. This compilation is the author’s own presentation of that data; it has not been verified against each company’s filings line by line, and it has not been checked or endorsed by any of the individuals named.
- Author disclosure. The author is Business Head at INVasset PMS, a SEBI-registered portfolio manager. This post is published in his personal capacity, it is not issued by or on behalf of INVasset PMS, and it is not a research report. The author, his family, his employer and its clients may hold, buy or sell positions in any of the securities named here at any time, without notice. Consult a SEBI-registered investment adviser before acting on anything you read.
- No connection to the individuals named. None of the eight investors has been contacted about this post, has reviewed it, or is associated with it or with the author. Their names are used only to identify the source of the public disclosures being described.
- Entity note. Where a holding is disclosed by an entity, a fund, an LLP or a family vehicle, rather than by the individual personally, it is shown under that individual’s name for readability. The tables do not distinguish between personal, family and managed holdings. Company names follow the source compilation and are abbreviated in places.
- Spotted an error? Corrections are welcome and will be made, write to the author via the links at the foot of this page.