

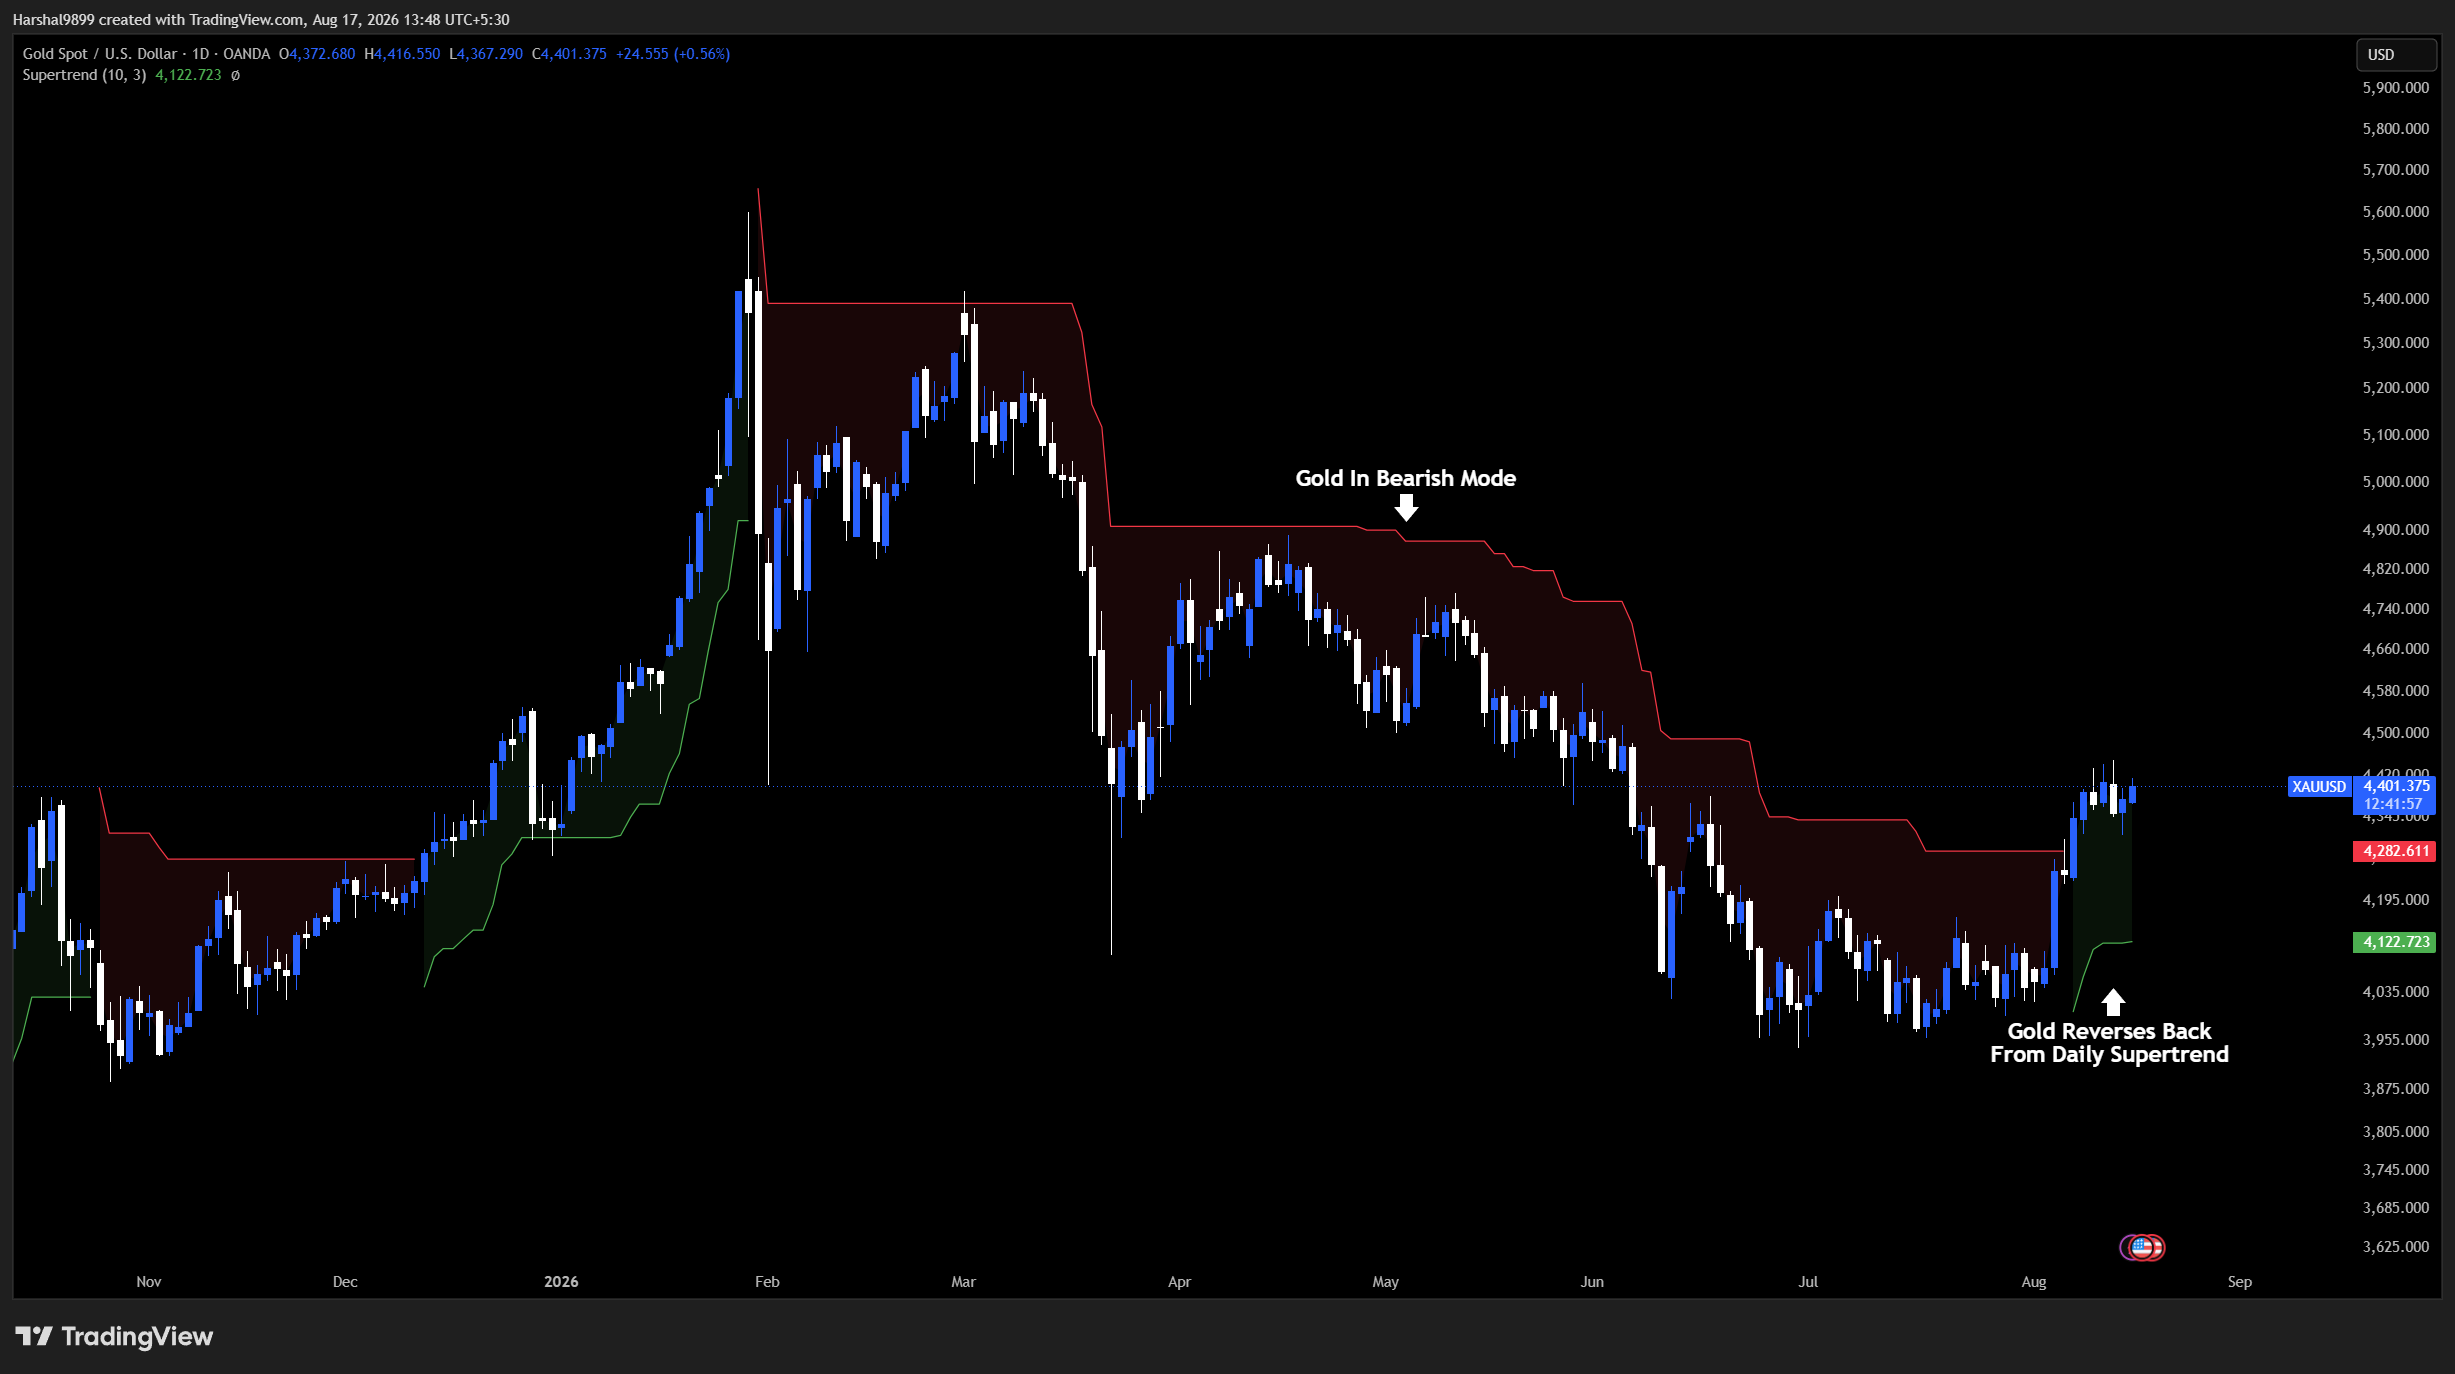
For most of 2026 the gold and silver charts told one story: a blow-off top in late January, then months of lower highs grinding down against every bounce. That story just changed. Price is back at the falling trendlines that defined the whole correction, the moving-average stack has been rebuilt underneath, and the daily supertrend has flipped bullish on both metals for the first time since the February breakdown. Here is the full read, in order: price action first, then the EMAs, then the supertrend on the daily, and finally the monthly picture.
Price action: both metals are pressing their falling trendlines
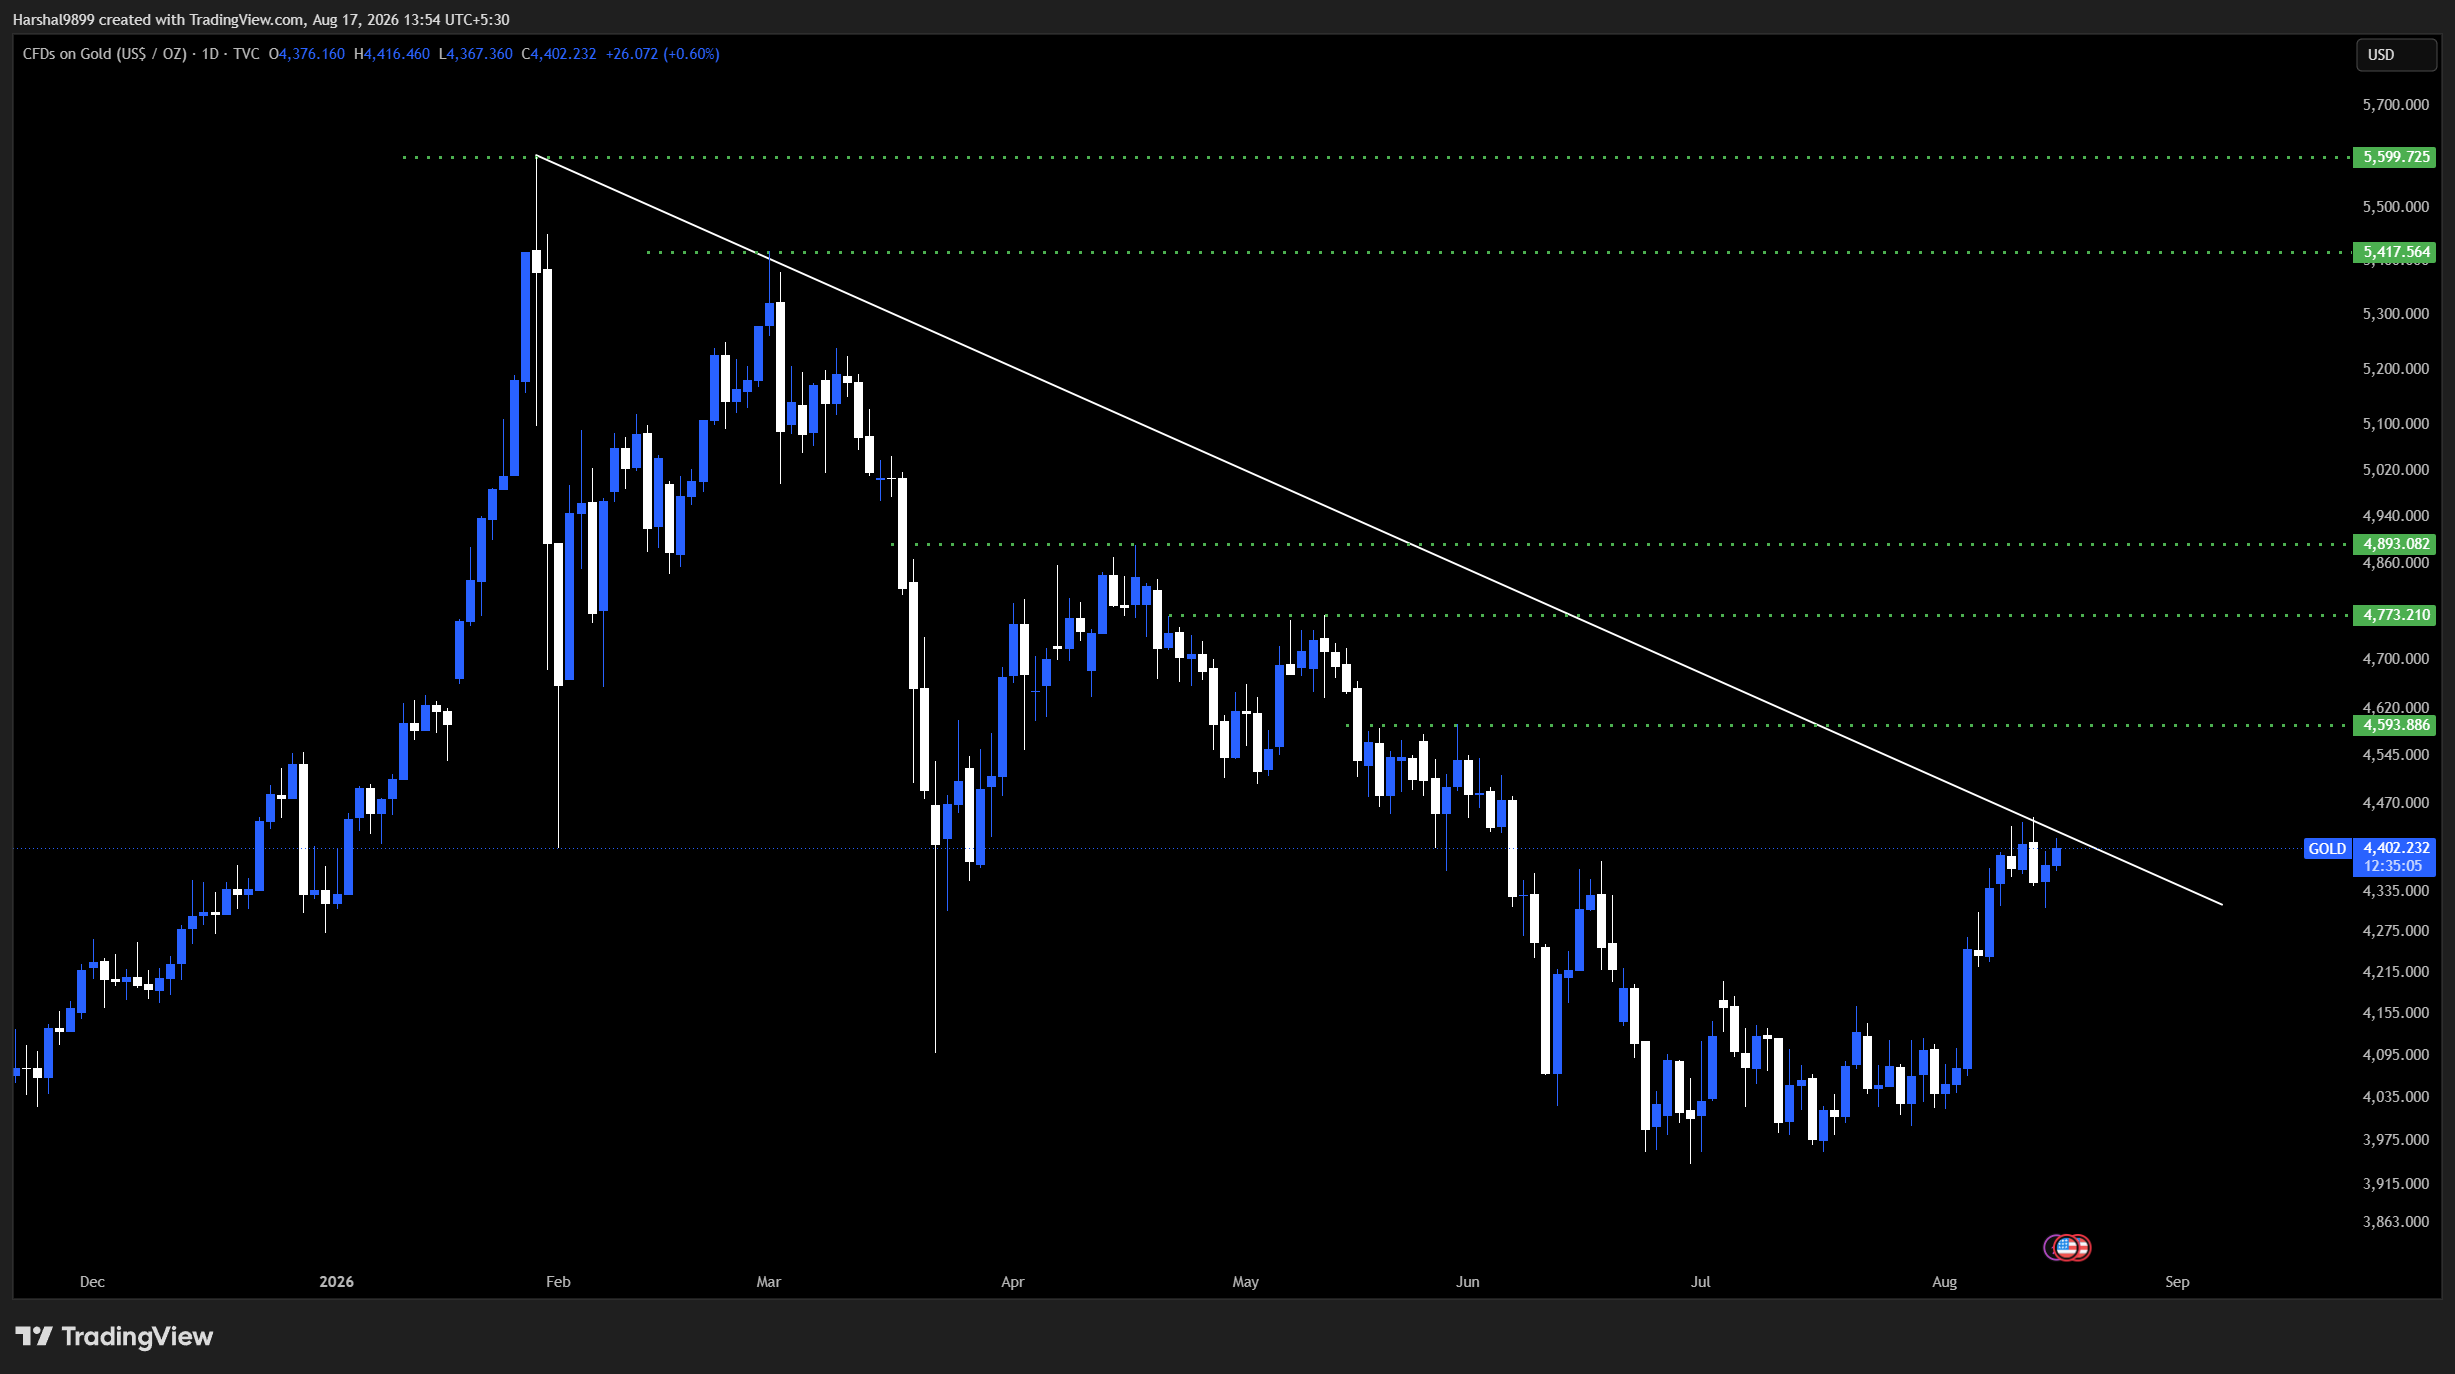
Draw a line from gold’s $5,600 top through the March and May lower highs and you get the trendline that has defined this entire correction. Price, near $4,402, is now pressing directly against it, and a breakout attempt is clearly building. Above the line, the resistance ladder is well defined: roughly 4,594, then 4,773, then 4,893, and beyond those the old air pockets at 5,418 and the record zone near 5,600.
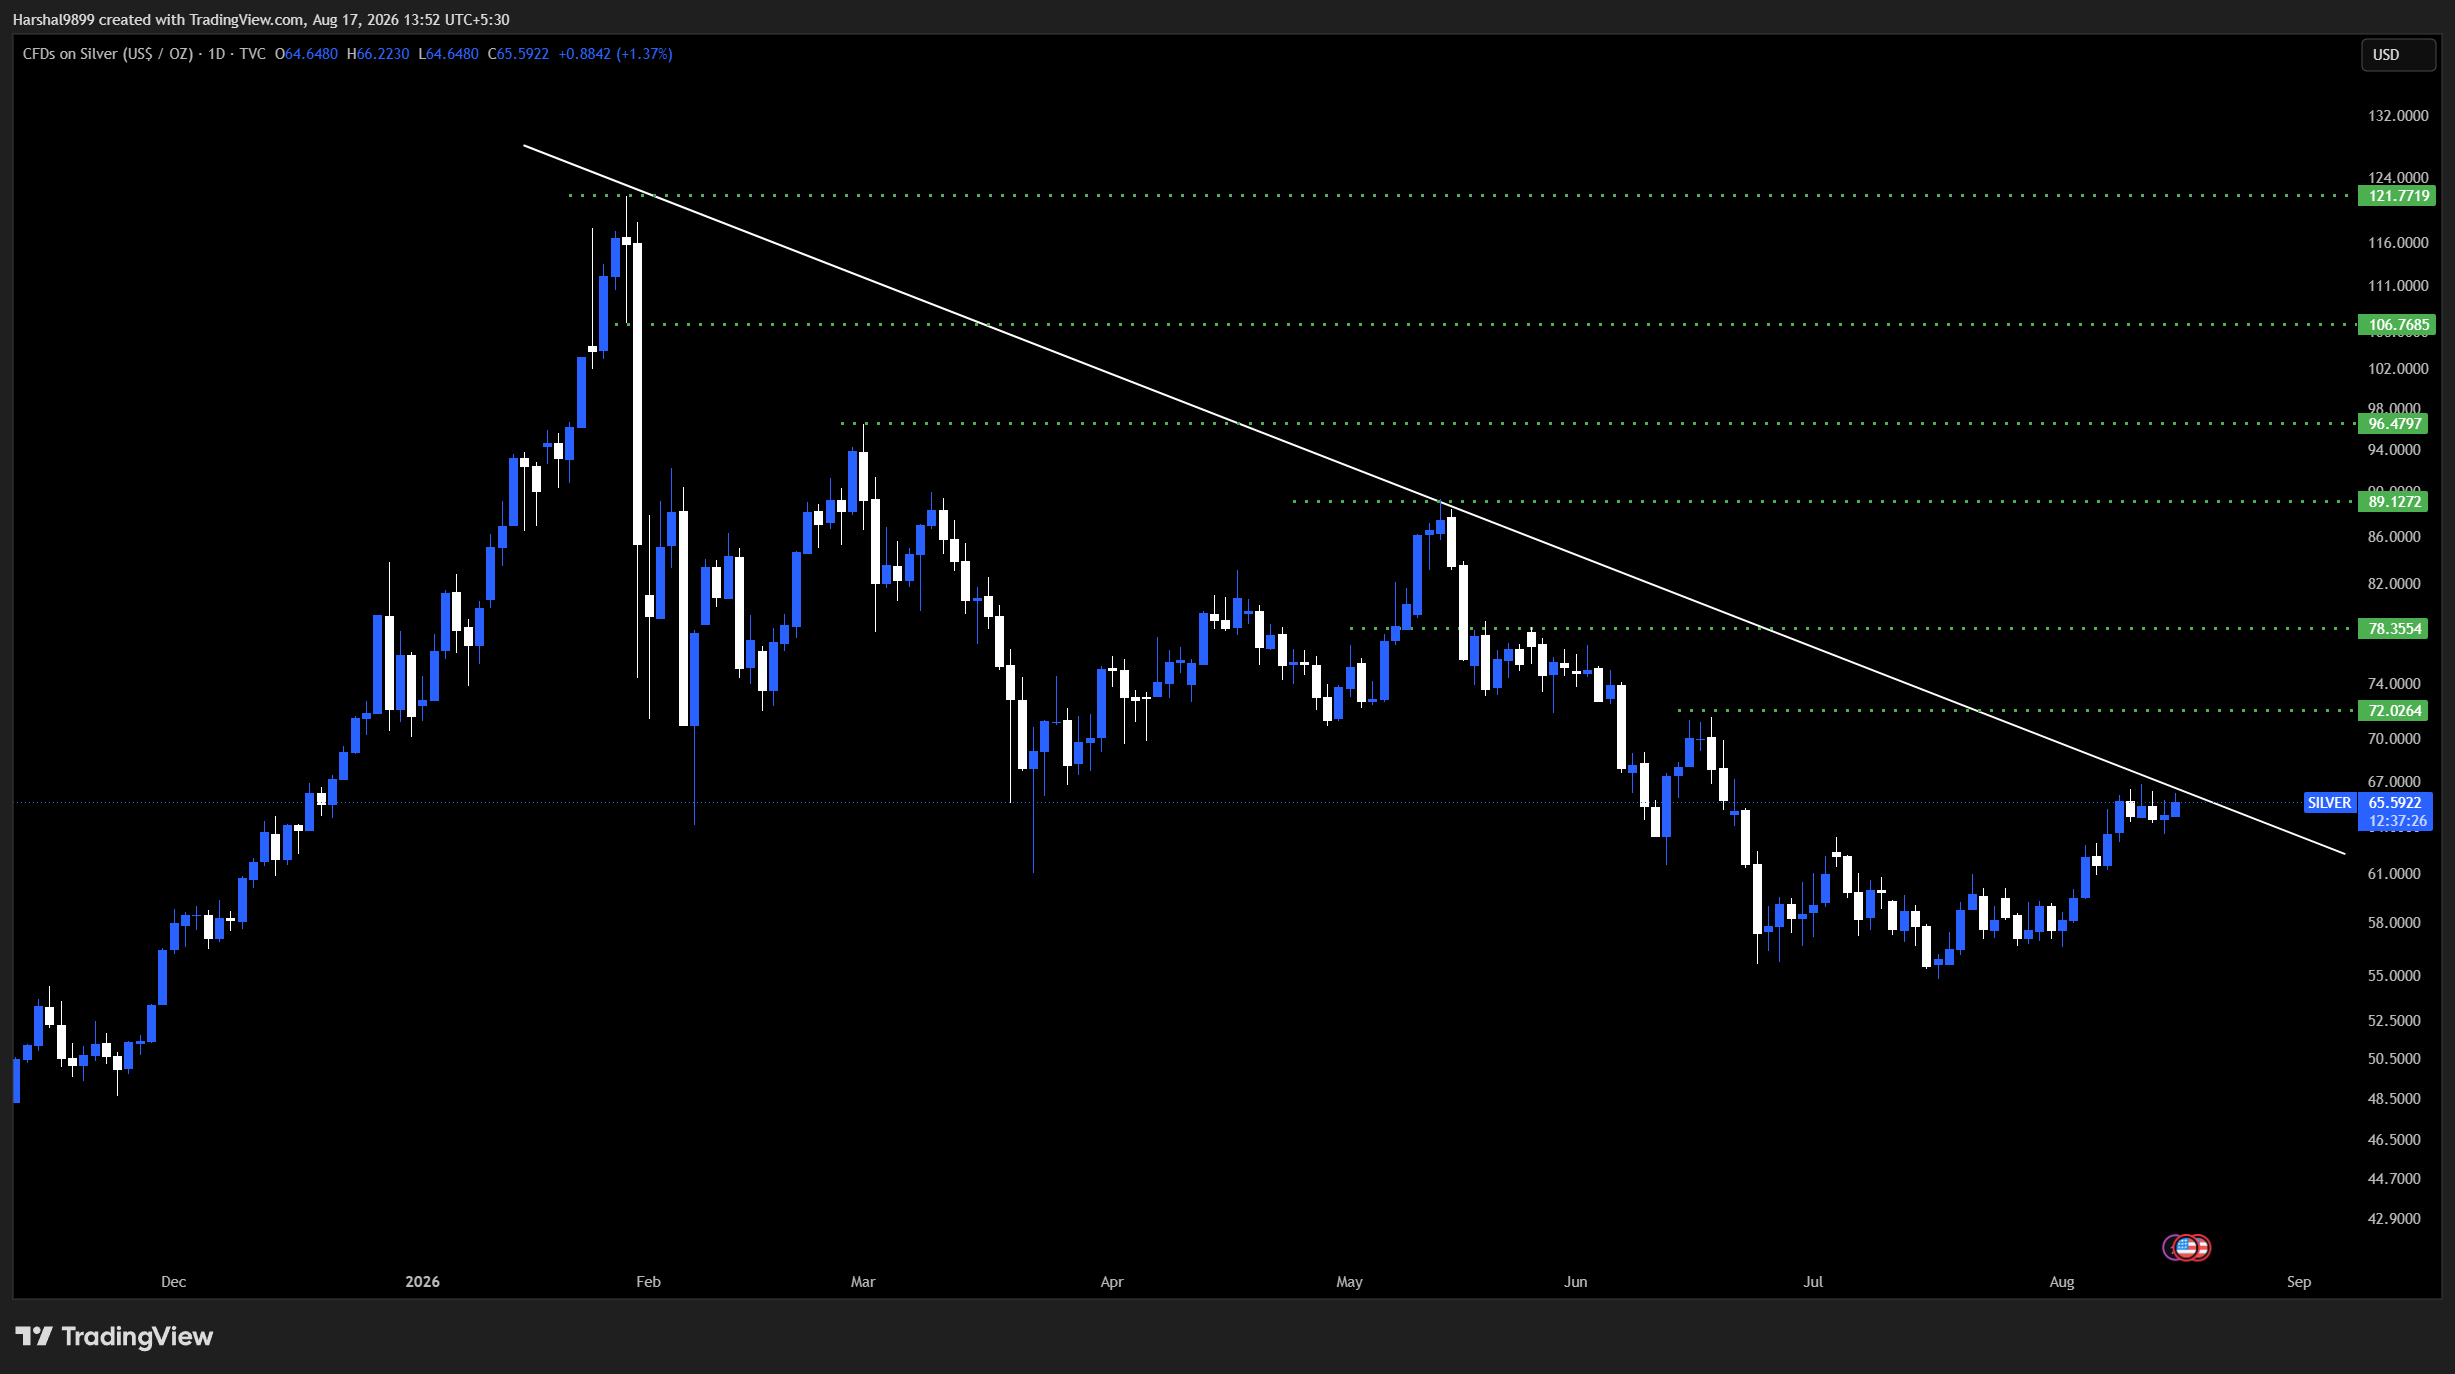
Silver’s version of the same line runs from the $122 peak through the May rejection near $89, and price is testing it near $66. The ladder above is longer because the fall was deeper: roughly 72, then 78.4, then 89.1, then 96.5, then 106.8, and finally the record zone near 121.8. Nobody trades a chart straight from 66 to 121; the point of the ladder is that each rung is a place where the market will argue.
The EMA stack: gold is clean, silver has one gate left
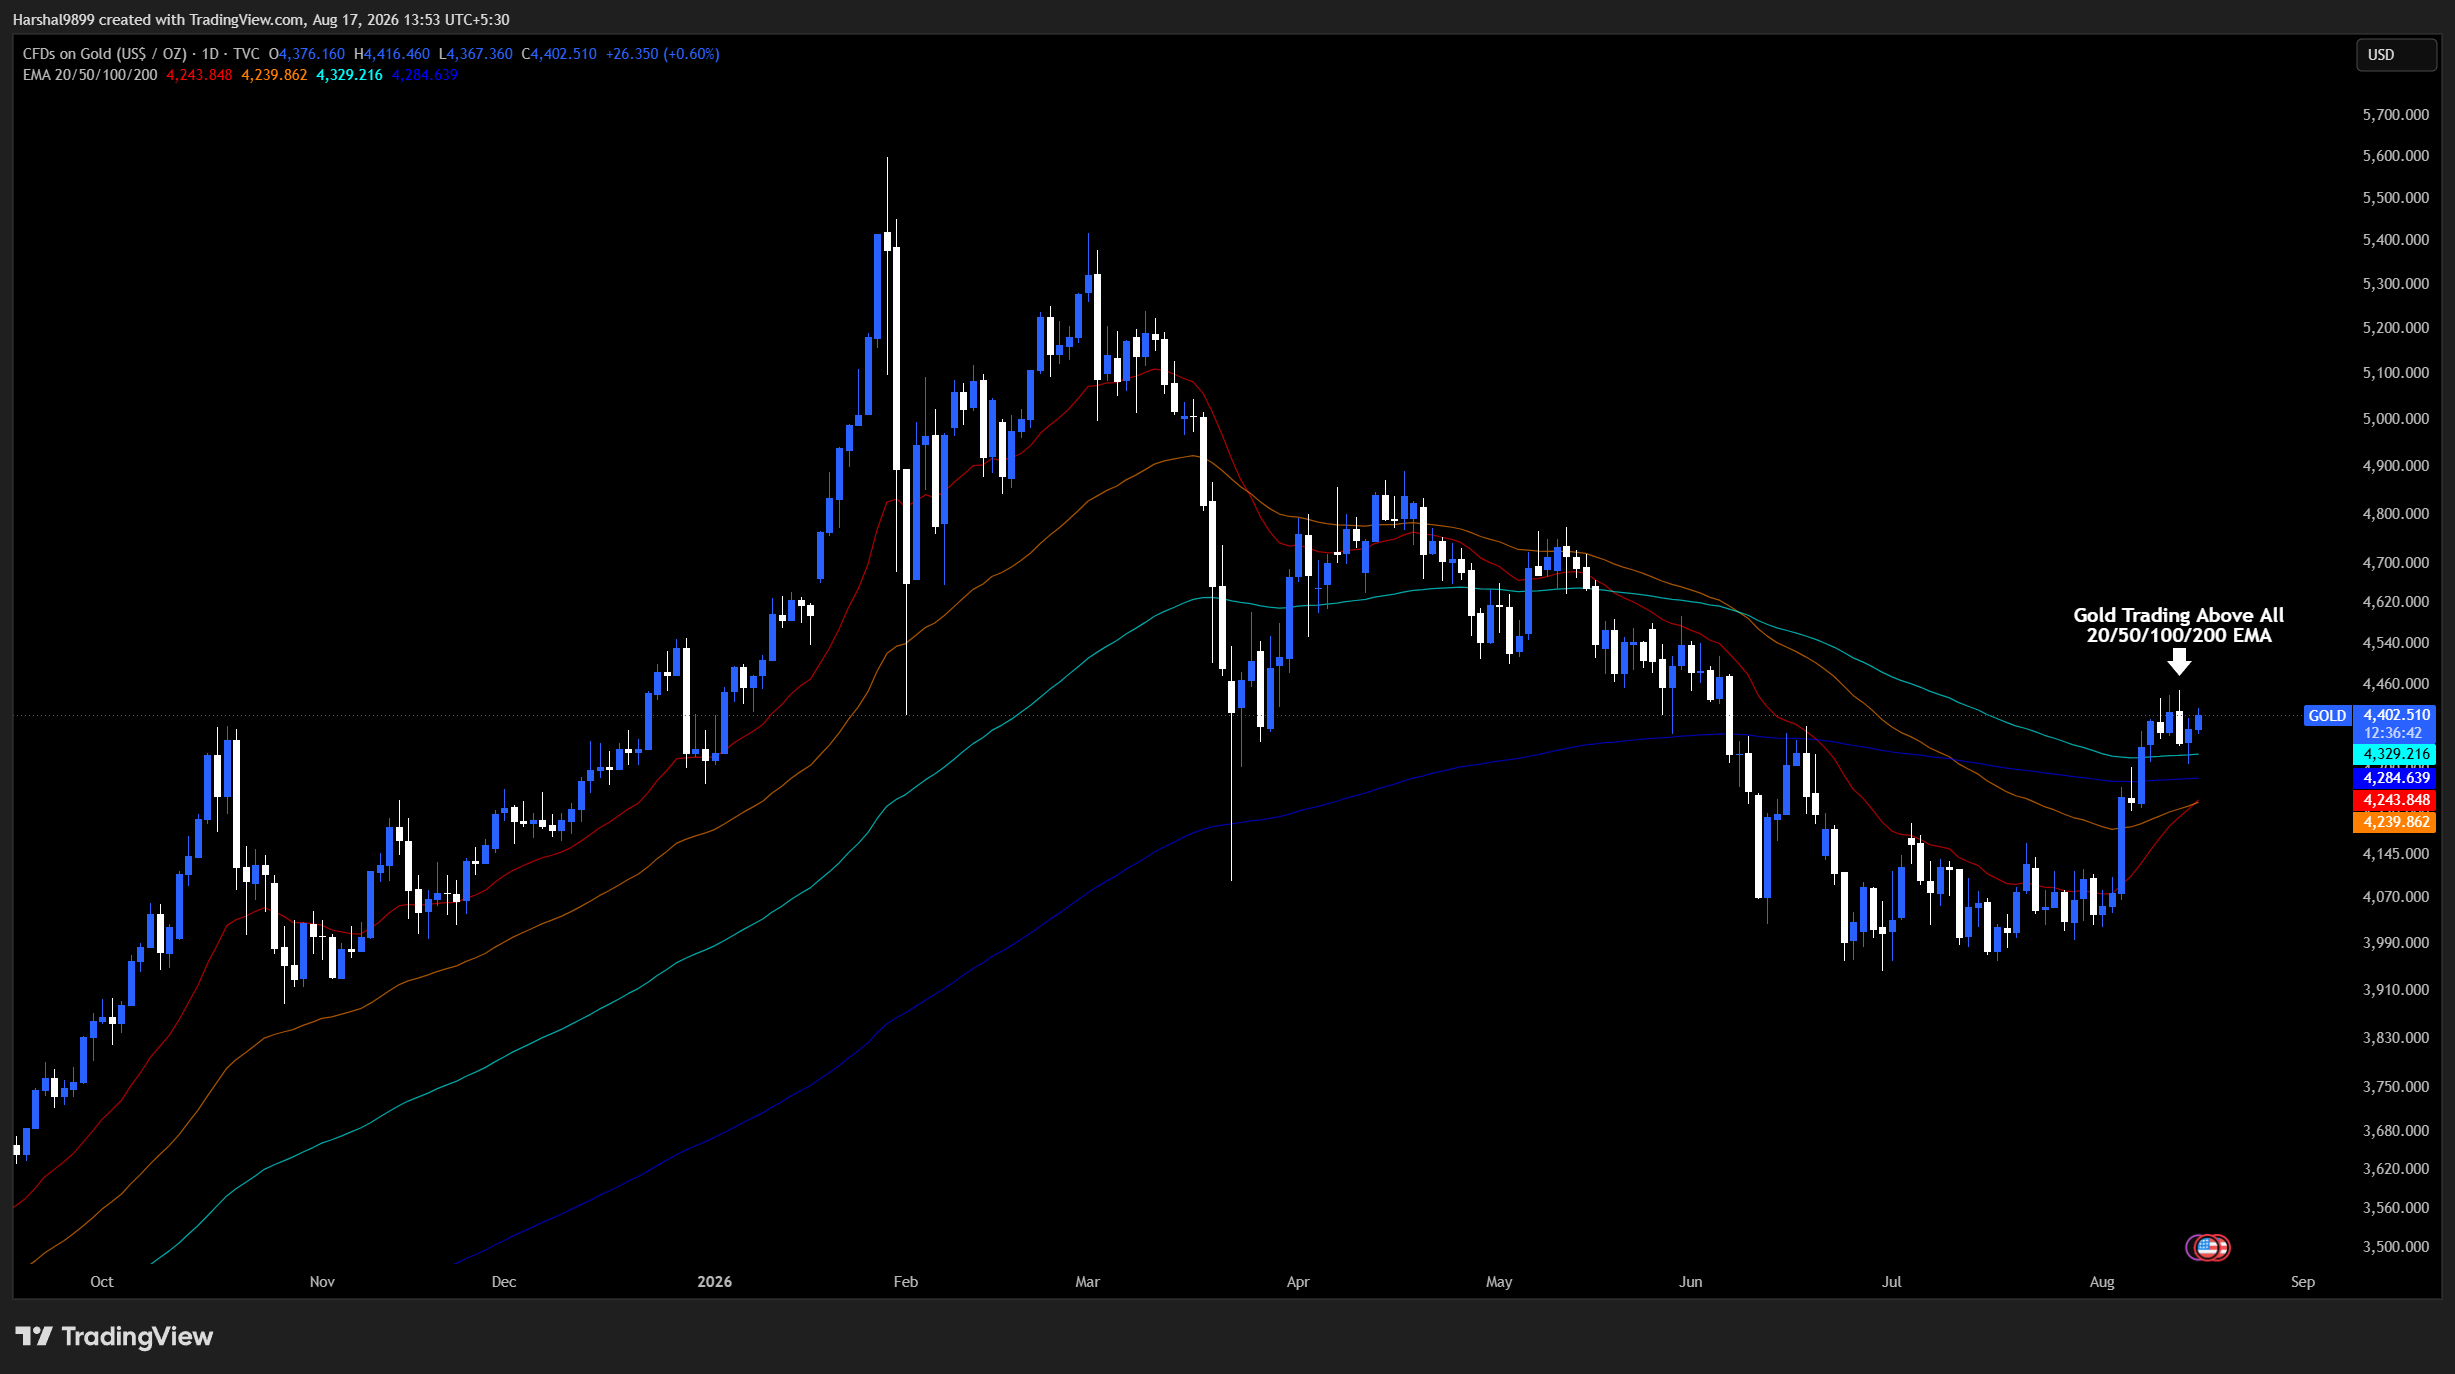
Gold has done the harder part already. Price is trading above all four of the daily EMAs that matter, the 20 near 4,244, the 50 near 4,240, the 100 near 4,329 and the 200 near 4,285. Notice the order: the 20 has crossed back over the 50, and price sits above the entire stack. That is what the early innings of a repaired trend look like, the averages flattening and curling up underneath price rather than pressing down on it.
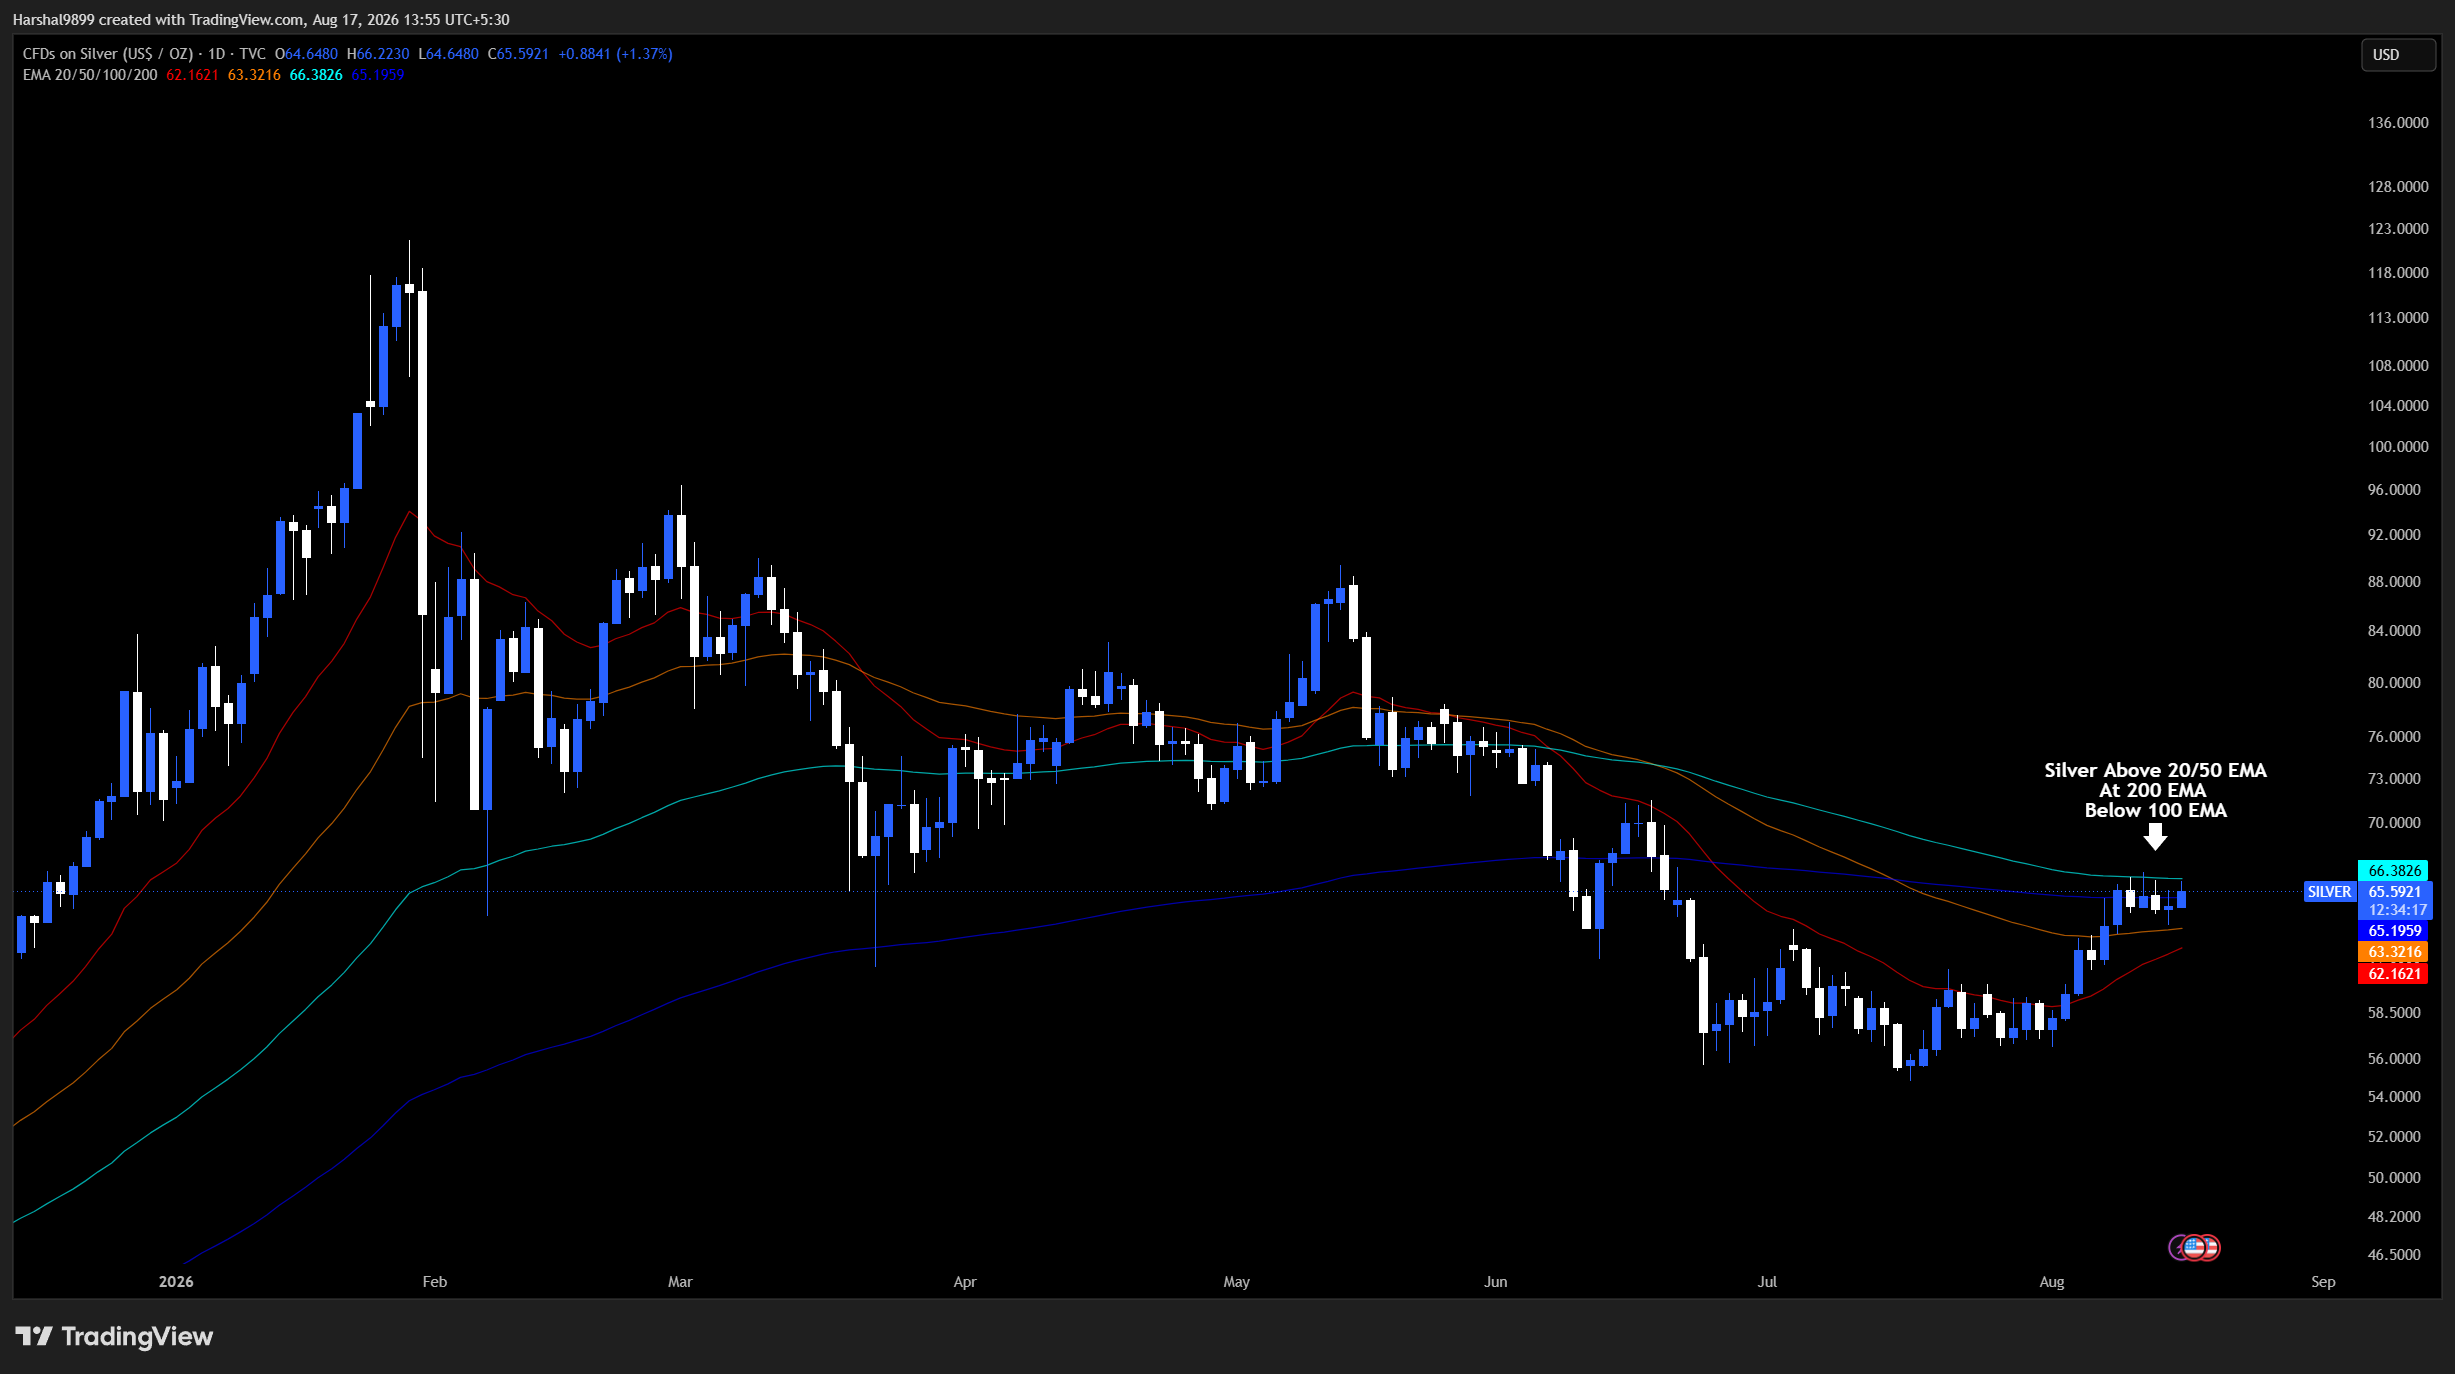
Silver is one gate behind. It trades above the 20 EMA (about 62.2) and the 50 (about 63.3), and it is wrestling with the 200 (about 65.2) at current prices. The one line still overhead is the 100 EMA near 66.4. That is the cleanest single trigger on either chart: a daily close above roughly 66.4 puts silver above its full stack for the first time since the top, and turns the moving-average complex from resistance into support.
Daily supertrend: the flip has happened
The supertrend indicator (10, 3) is a blunt instrument, and that is precisely its value: it does not flip on noise. Gold spent almost six months in bearish mode, with the indicator capping every rally from February through July. That cap has now broken. With spot gold near $4,401, the flipped supertrend sits below price as support at roughly $4,123.
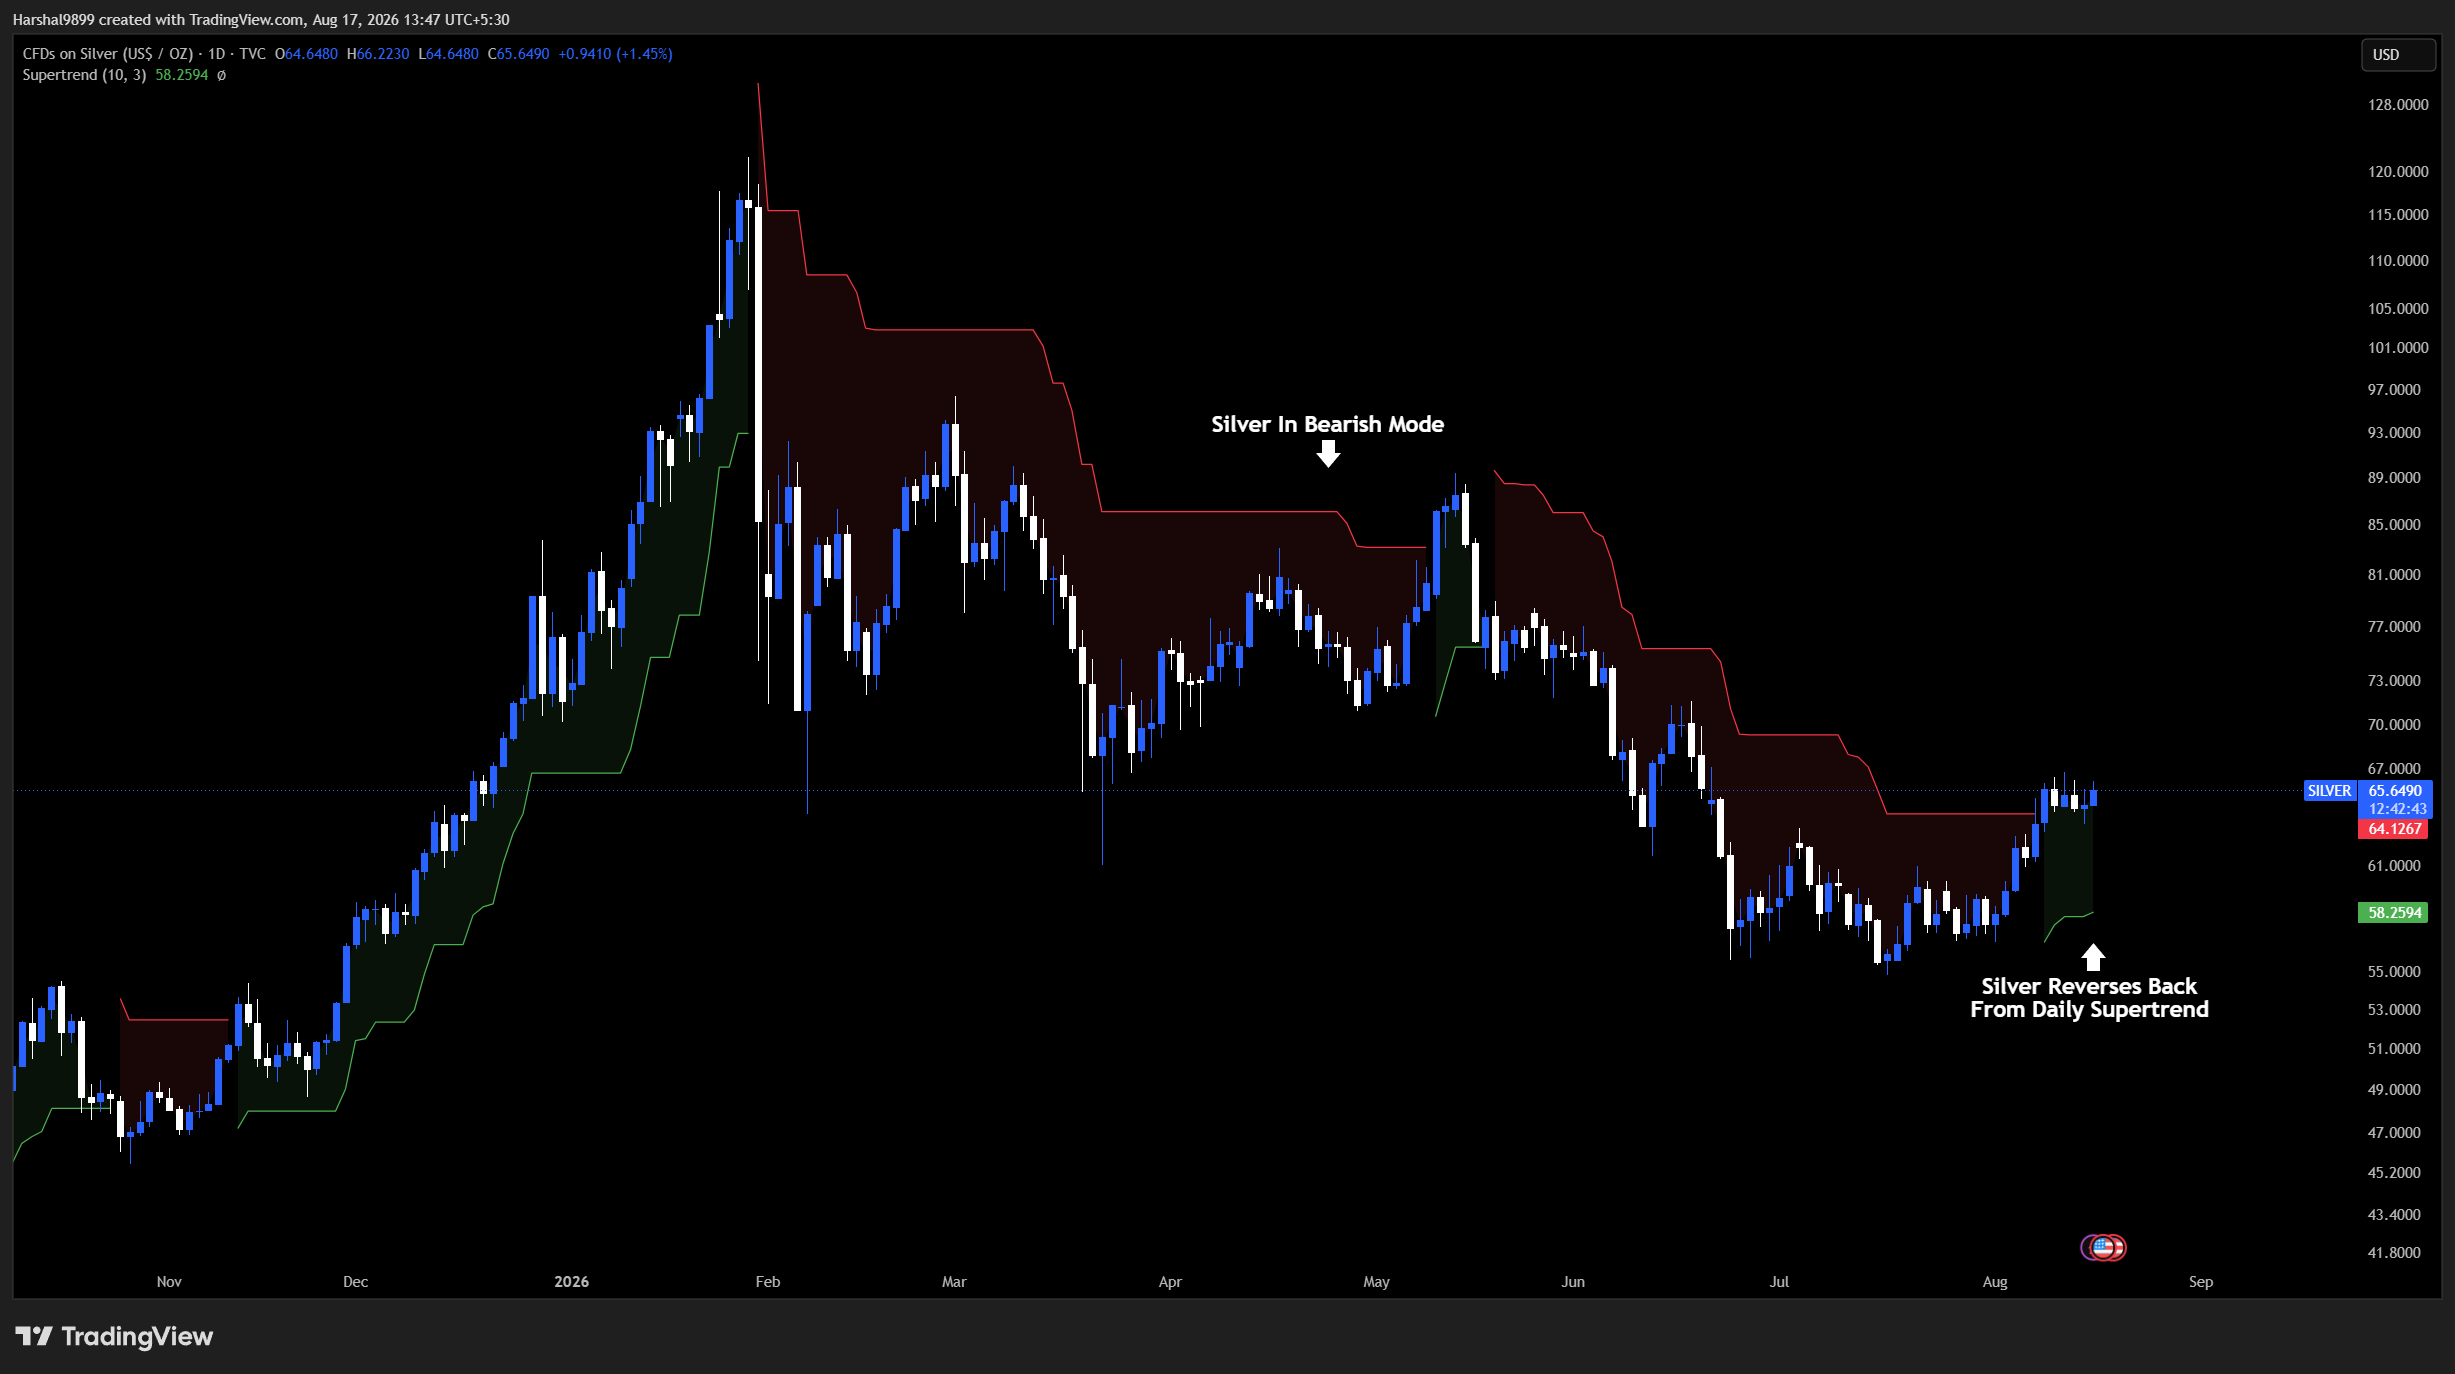
Silver is the same picture with higher beta. From the $122 January peak, silver fell into the mid-$50s, and the supertrend stayed red the whole way down. The August reclaim puts silver near $65.6 with the indicator flipped to support at roughly $58.3. When a trend-following tool that stayed bearish for half a year finally turns, it is not a prediction, it is a regime description: the sell-every-rally phase has, for now, ended.
Monthly supertrend: the bigger trend never broke
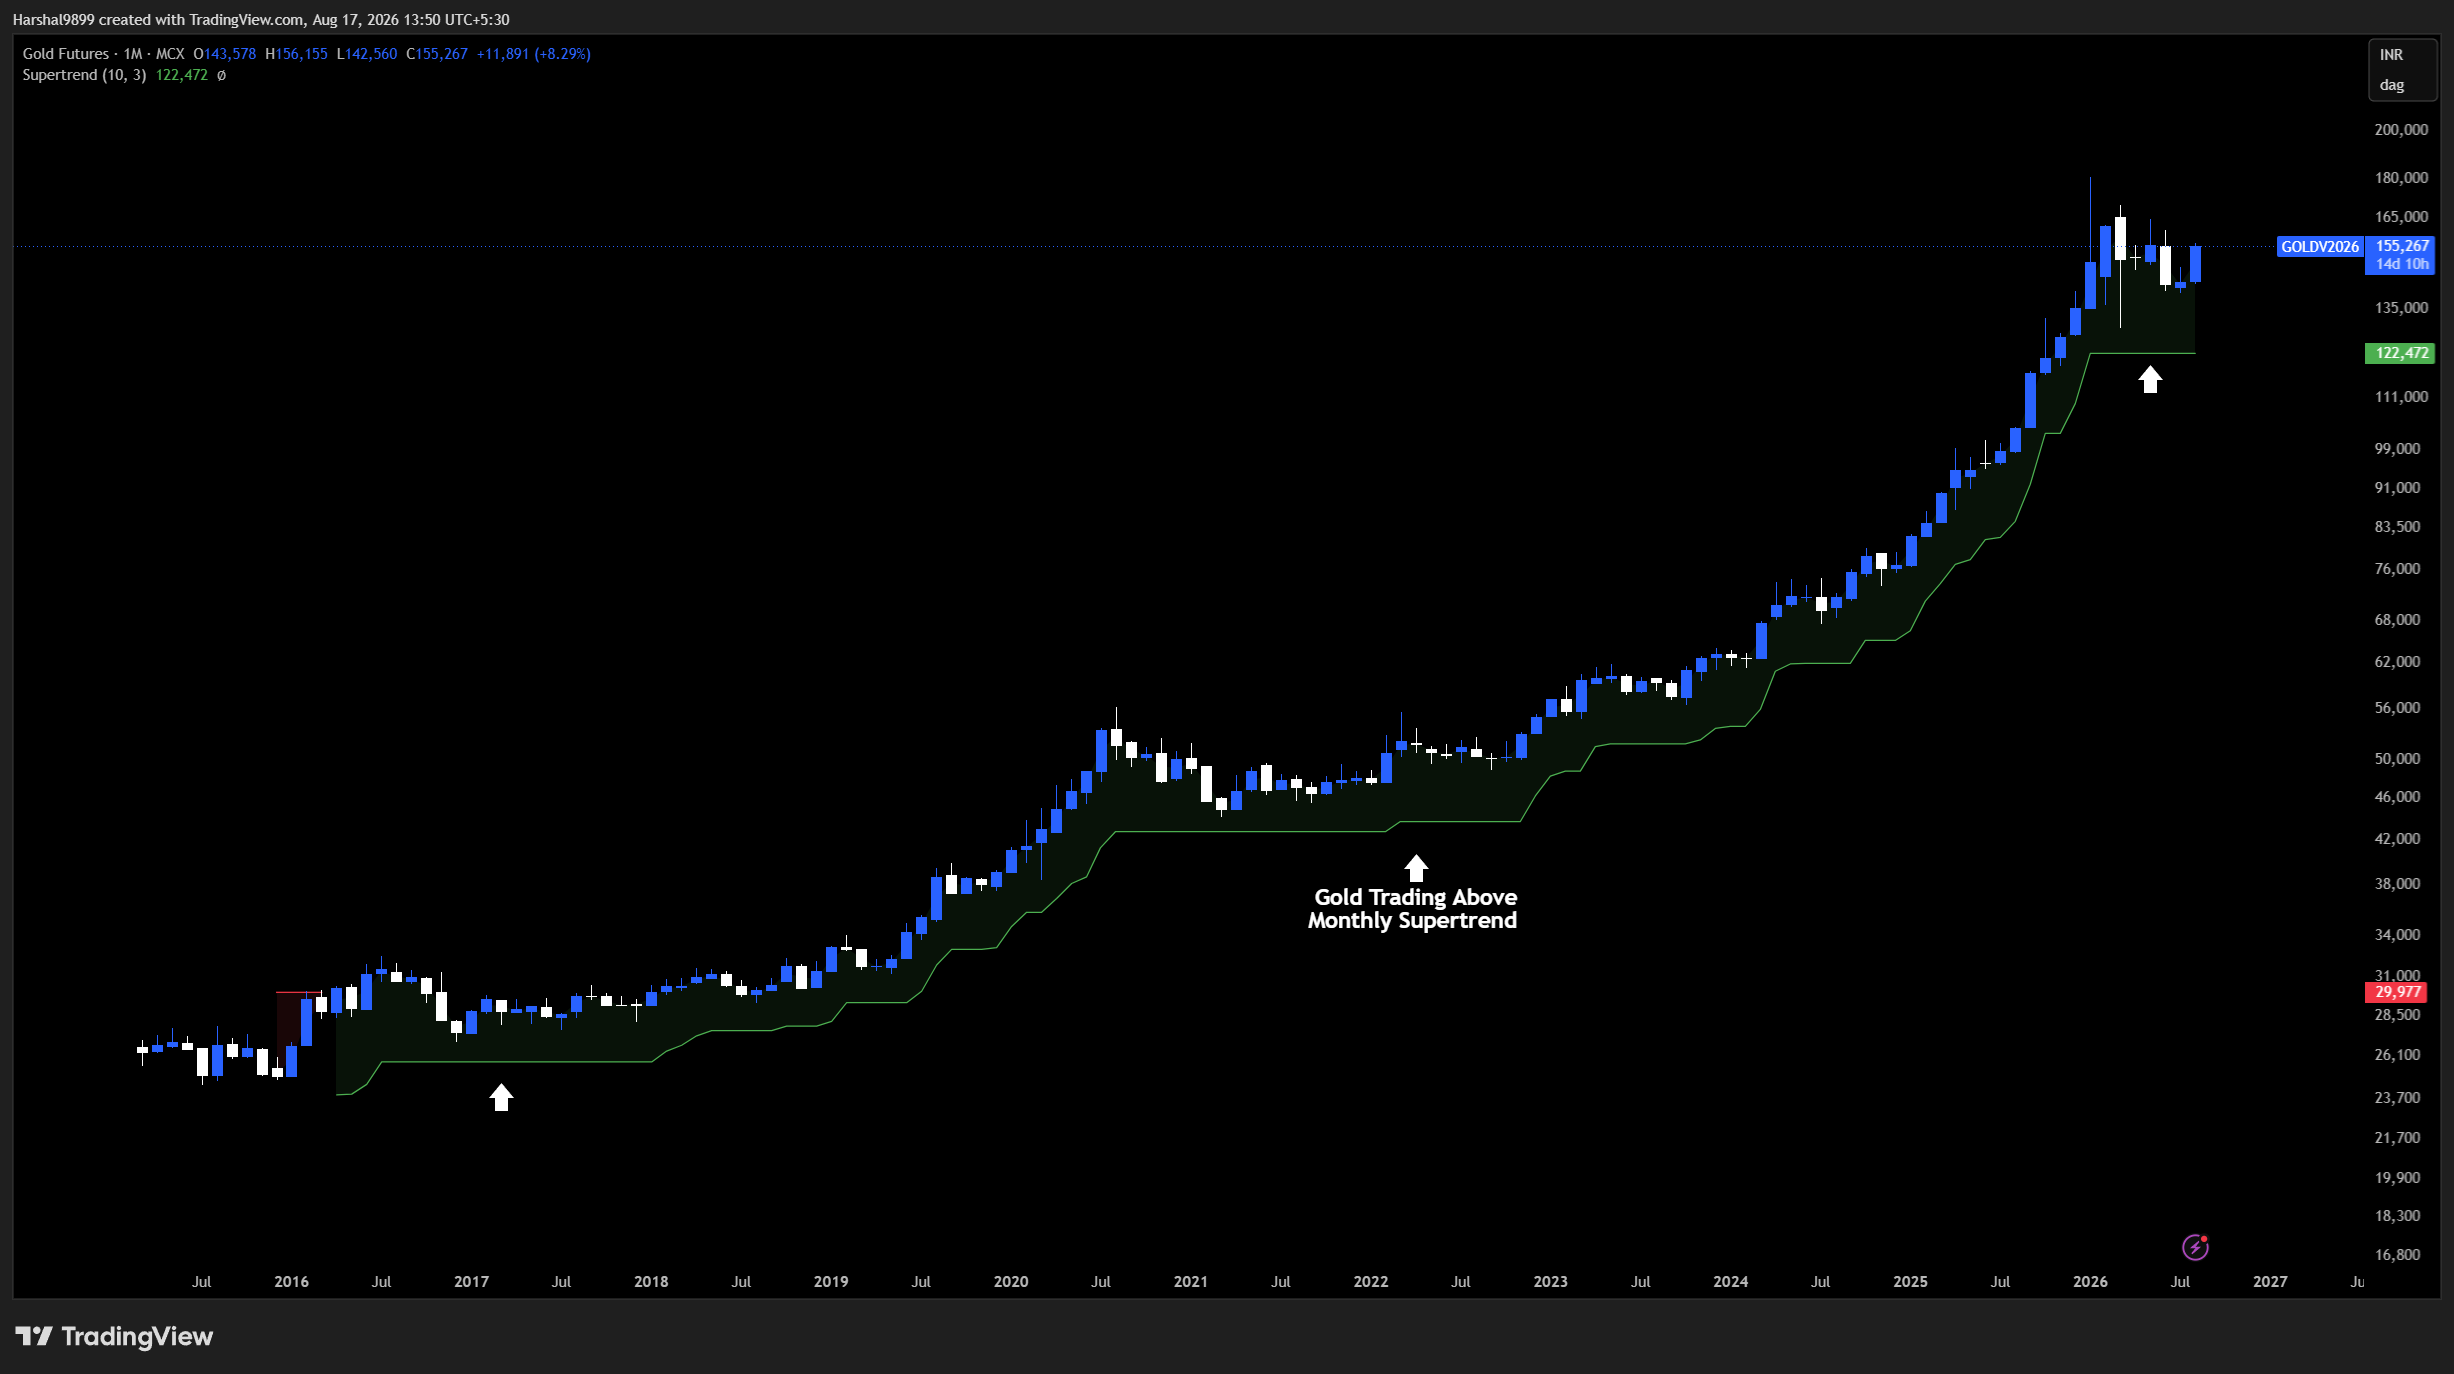
Here is the context that makes everything above worth taking seriously. On the monthly MCX charts, neither metal ever lost its long-term supertrend through the entire 2026 correction. Gold futures trade near ₹1,55,267 per 10 grams against monthly supertrend support near ₹1,22,472, a trend that has been unbroken for roughly a decade.
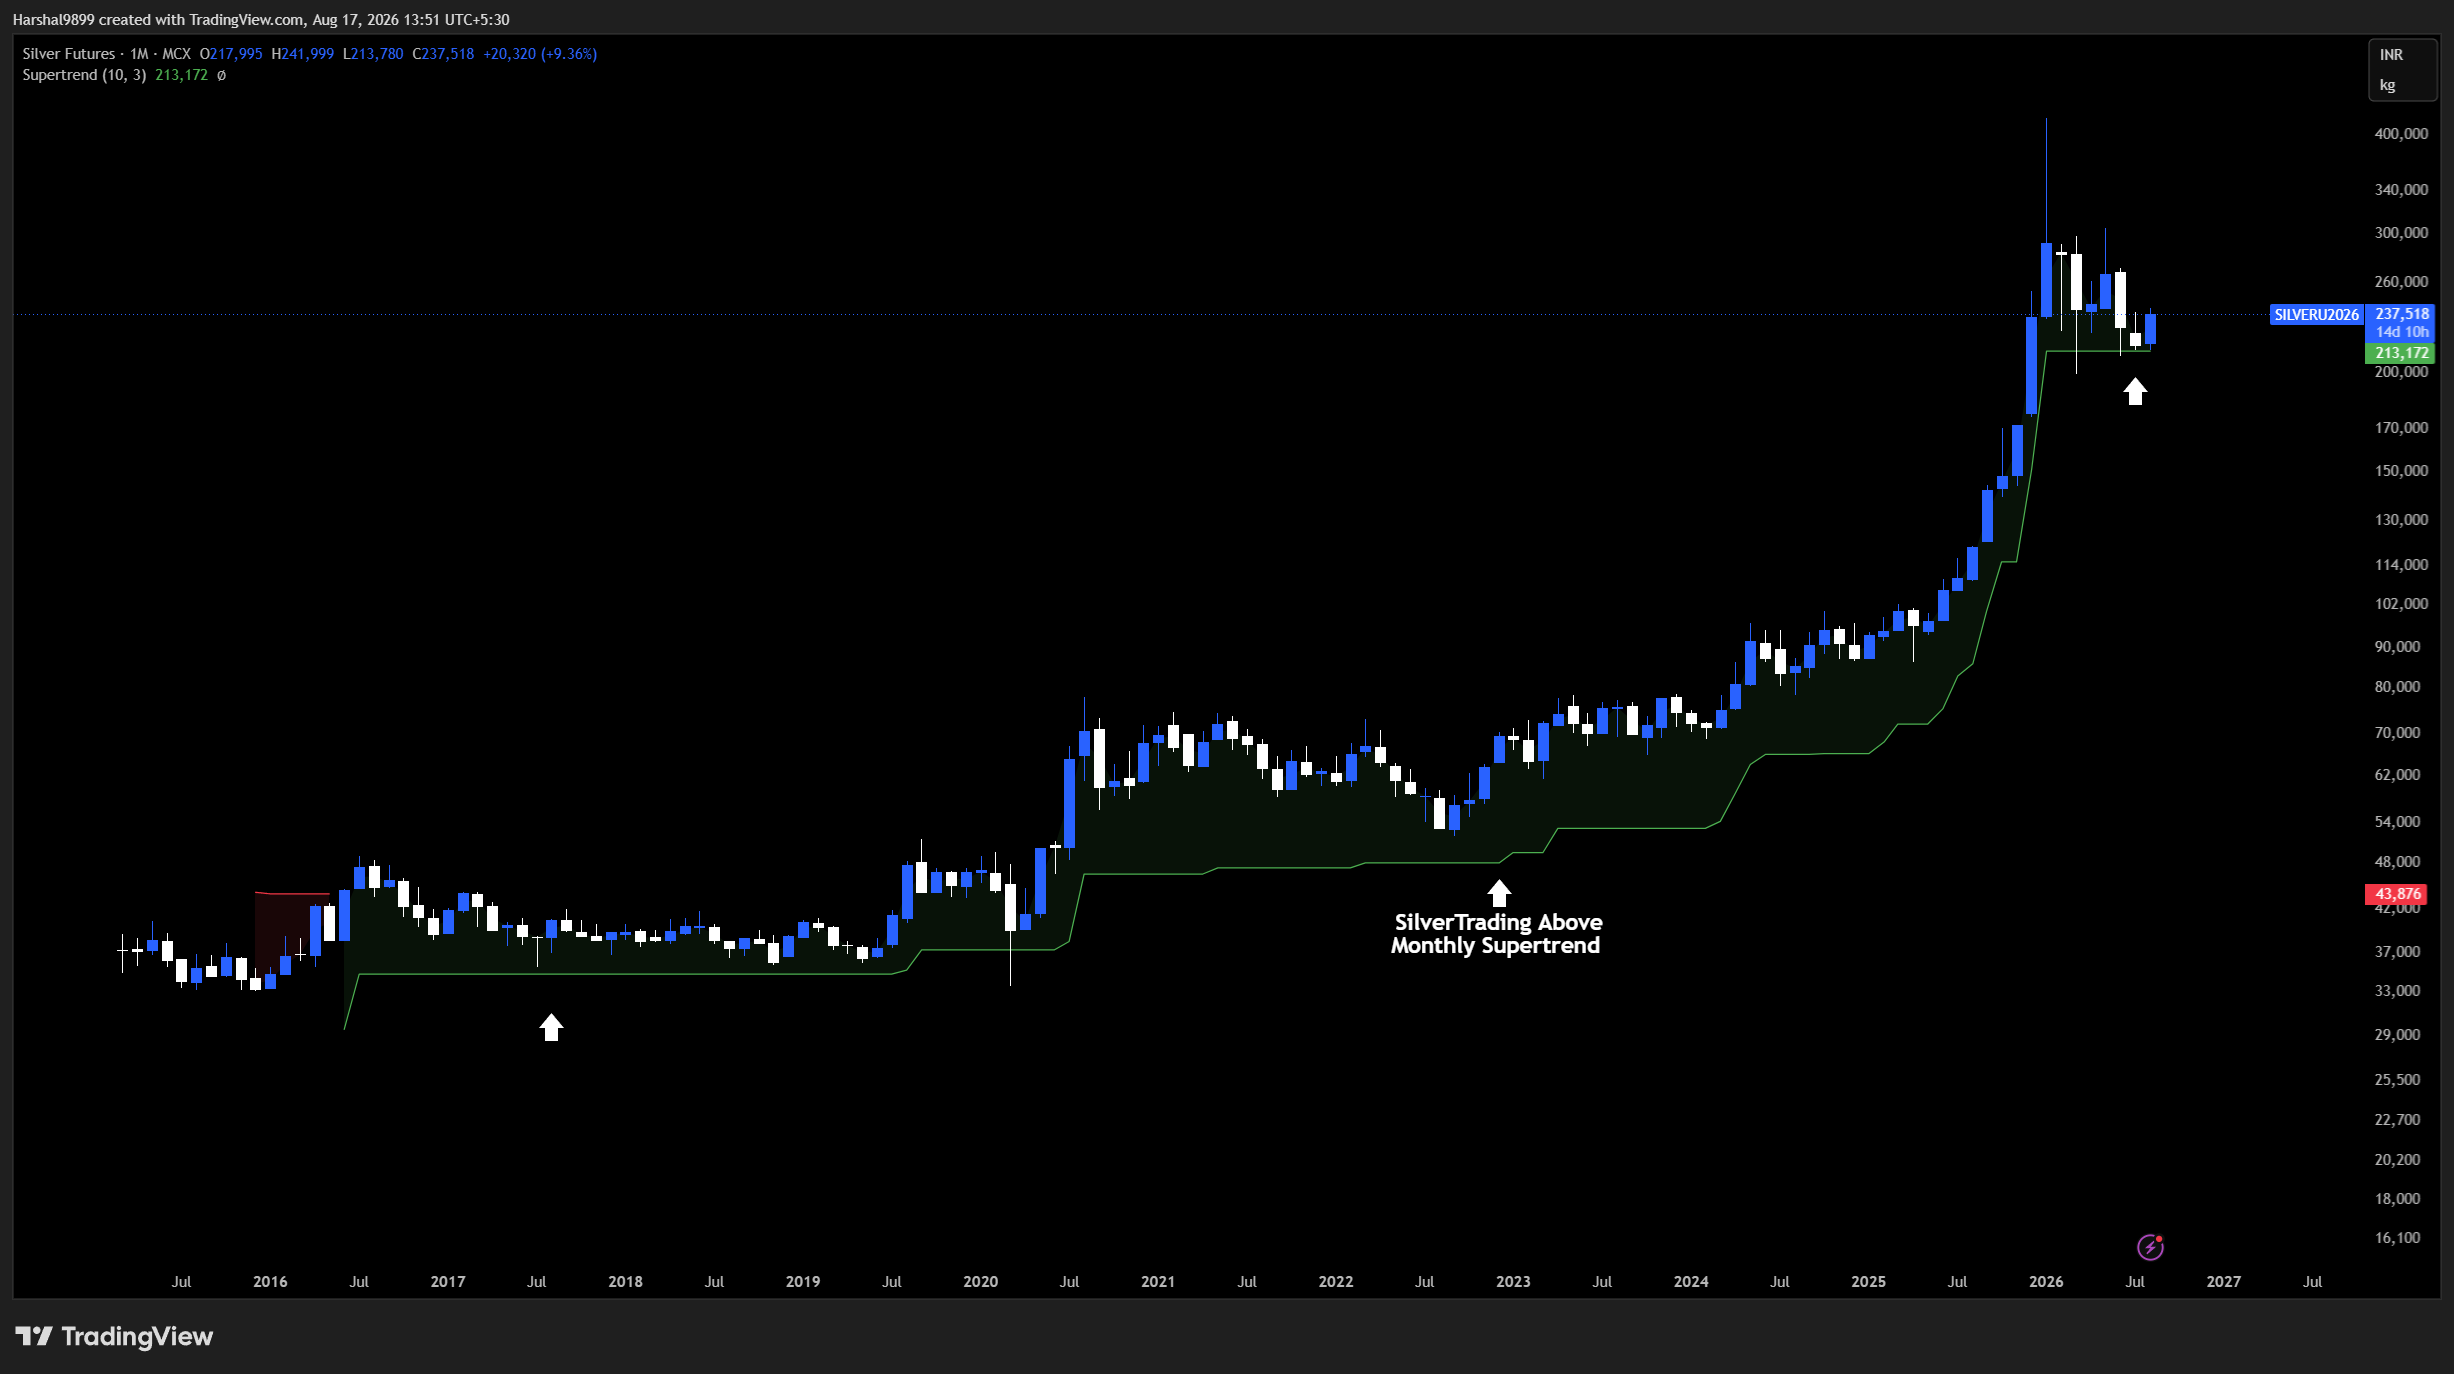
Silver futures trade near ₹2,37,518 per kilogram against monthly support near ₹2,13,172, and August is running up roughly nine percent. In other words, the worst correction either metal has seen in years registered on the monthly timeframe as a pullback within an uptrend, not a break of one. Daily signals carry more weight when they fire in the direction of the higher timeframe, and that is exactly the configuration here.
The read
Put the four layers together and the checklist is unusually clean. Price action: both metals are pressing the trendlines that capped the entire correction, and a breakout attempt is building. EMAs: gold is above its full stack, silver needs one close above roughly 66.4. Daily supertrend: flipped bullish on both, with supports at roughly 4,123 and 58.3. Monthly: the long-term uptrend was never in question.
What confirms the setup: for silver, a daily close above the 100 EMA near 66.4 followed by a push through the trendline, with 72 as the first target overhead. For gold, a clean break of the trendline opens 4,594 first, and the character of the tape changes materially above 4,893, because from there the chart is looking at the old highs. What negates it: a fall back below the fresh supertrend supports, roughly 4,123 on gold and 58.3 on silver, would put both metals back inside the old corrective range and reset the clock.
The metals are doing this together, which is the tell that something macro sits underneath, but the charts do not need the macro story to be tradeable. The levels are mapped. Now it is about which side of those lines the closes land on.
- Price action: both metals are pressing the falling trendlines drawn from their record highs, with breakout attempts building.
- Gold’s resistance ladder: 4,594 → 4,773 → 4,893 → 5,418 → 5,600. Silver’s: 72 → 78.4 → 89.1 → 96.5 → 106.8 → 121.8.
- EMAs: gold trades above all four daily EMAs (20/50/100/200); silver is above the 20 and 50, at the 200, with only the 100 EMA near 66.4 left overhead.
- Daily supertrend (10, 3) has flipped bullish on both after roughly six months in bearish mode, with fresh supports near $4,123 and $58.3.
- On monthly MCX charts, neither metal ever broke its long-term supertrend, the 2026 correction was a pullback within an uptrend.